A performance budget is a number agreed before the work starts, a share of it for each part, and a check that says when a part has gone over. Without one, every feature costs "only a millisecond", and the milliseconds add up until the app stutters and nobody can say which feature did it.
The advice here comes from three projects: a game aiming for a steady 100 frames a second, a board app whose rule is that heat is a bug, and this library, which measures every entry it ships.
Rules marked always protect people and hold; defaults are where to start, and you may break one when you can say why; ideas are suggestions.
Before you start
- (default) The target is written down: a frame rate, a resolution, a pixel ratio and the device.
- (default) The frame is split into shares, with some left spare for the browser.
- (default) The worst frames have a budget too, not only the average.
- (default) Work that can wait shares one allowance a frame, spent in order of what matters most.
- (default) Each quality tier has its own budget in counts (particles, lights, cards), and the device picks the tier.
- (default) Nothing draws while nothing changes.
- (default) Every measurement names what it was taken on.
- (default) A missed budget is fixed or argued about, never quietly raised to match.
Write the number down
Pick a frame rate and turn it into milliseconds: that is the whole frame, for everything.
| Target | One frame |
|---|---|
| 60 fps | 16.7 ms |
| 100 fps | 10 ms |
| 120 fps | 8.3 ms |
| 144 fps | 6.9 ms |
Write the resolution and pixel ratio down with it. A 1920×1080 canvas at a pixel ratio of 2 has four times the pixels of the same canvas at 1, and anything drawn per pixel costs about four times as much. Write down the device too: a budget met on a desktop graphics card says nothing about a phone.
The CPU and the GPU work side by side, so each gets the whole frame. A frame takes as long as the slower of the two. Keep about a fifth of each spare: the browser, garbage collection and the compositor need it, and they don't ask first.
Tried on the game. Its target is "steady 100 fps at 1920 × 1080", which is 10 ms, measured on the author's laptop with an external monitor. Its first gate asked the browser for a 1600×900 window and got a 1584×749 canvas. A later review set 1920×1080 in the browser and checked the canvas itself before believing any number.
Spend a frame
Interactive figure “spend-a-frame”: it runs in the full playbook in the library.
The figure adds up real costs: each effect is its demo's GPU time, measured on this library's reference laptop at 1920×1080 and a pixel ratio of 1. A demo includes its own scene, so treat each as an upper estimate. Effects that share a full-screen pass often cost less together than apart. On another device, measure there.
Budget the worst frames
An average hides the frames people notice. One run of the game had a typical frame of 7.9 ms, comfortably inside 10. Yet one frame in five ran over 10 ms, the slowest 1% took 31 ms or more, and the worst took 137. What the player saw was stutter, not a fast game.
So budget four numbers, not one:
- The median (p50). The typical frame, which should sit well inside the budget.
- The 95th percentile (p95). One frame in twenty may be slower than this.
- The 99th percentile (p99) and the worst frame. Hitches you can see.
- Hitches. Frames over a threshold (the game uses 34 ms, two missed frames at 60), counted over a fixed route.
When a run misses, the budget stays where it is. The same review found the game failing its own gate (5.5 ms at p95, at most four hitches, none worse than 80 ms) and said outright not to raise the gate to match. The gate is there to keep regressions from becoming the new normal.
One allowance for work that can wait
Some work doesn't have to finish this frame: loading the next piece of the world, baking a texture, building a mesh. Give each system its own budget and they will one day all have work on the same frame. Their shares then add up past the whole frame.
The game had exactly that: its streaming systems had budgets of 3, 1.5 and 1.5 ms, and one with none at all. Now they share one allowance: whatever a 10 ms frame leaves after the simulation and rendering, kept between 1 and 3 ms. The work most needed comes first:
/** What the frame leaves for work that can wait, kept between `min` and `max` ms. */
export function allowance(frameMs: number, reservedMs: number, min = 1, max = 3) {
  const end = performance.now() + Math.min(max, Math.max(min, frameMs - reservedMs));
  return { open: () => performance.now() < end };
}

// Most needed first: the ground under the player before the grass on it.
const budget = allowance(10, simulationMs + renderMs);
for (const system of [ground, buildings, collision, grass]) {
  while (budget.open() && system.hasWork()) system.step(); // one small unit at a time
}
A system starts a unit of work only while time is left, so a frame overruns by one unit at most. Keep the units small.
Tried on the game. One deadline replaced four separate budgets for streaming, bakes and fields. The frame's other work is reserved from its recent average, so a heavy frame leaves less for streaming and a light one doesn't take on a burst.
Budgets per device, in counts
Milliseconds change with the machine, the heat and the power plan. Counts don't. Give each quality tier a budget in the things that cost (particles, lights, overdraw, cards with an expensive look), and check those in tests, where no GPU is needed.
| Desktop | High-end phone | |
|---|---|---|
| Particles | 30,000 | 6,000 |
| Overdraw (layers of see-through sprites) | 60 | 18 |
| Effect lights | 2 | 0 |
That table is the game's effect budget. Each effect's cost model works out its counts against its tier's budget. The board app does the same with three quality levels:
| Cool | Balanced | Max | |
|---|---|---|---|
| Frames a second for ambient motion | 20 | 30 | 60 |
| Still after the last touch | 6 s | 15 s | 60 s |
| Sharpest pixel ratio drawn | 1.5 | 2 | the screen's |
| Cards given the full, expensive look | 16 largest | 40 | 80 |
Let the device pick its starting tier from what it can do (capability tiers), let the person change it, and hold the frame with the render scale when the scene gets heavy (dynamic resolution).
Tried on this library. An Intel Arc 140V laptop ran the heaviest demos at 10 to 59 ms a frame, where the reference laptop took 1 to 9. Every demo now gets a quality tier (high, medium, low) from its adapter and a 0.1 s probe draw, and the heaviest pass it to their module's
tieroption: fewer ray steps, cells, samples and pixels, never a different effect. Integrated GPUs start at low; the reference laptop stays high, so its costs stay comparable.
Tried on the board app. Its quality setting begins with one line: how hard this device may work, because heat is a bug. A laptop that warms up while someone reads a board is a defect, however smooth the frames are.
Spend nothing when nothing changes
The cheapest frame is the one not drawn:
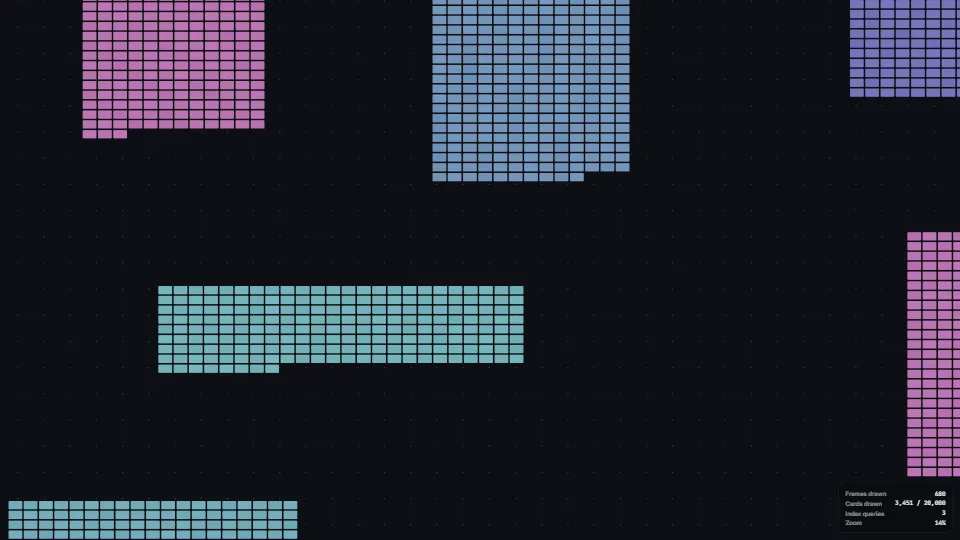
- (default) Render on demand. Draw when something changed, not 60 times a second regardless (infinite canvas shows how).
- (default) Let ambient motion rest. Background life stops a few seconds after the last touch.
- (default) Never compile while drawing. Building shaders can stall a frame for anything from milliseconds to seconds, so build them before the first frame (compile without stalls).
- (default) Keep counts steady. The game's WebGL renderer rebuilds every shader when the number of lights changes. So the scene keeps spare lights at zero brightness, and a muzzle flash takes a spare instead of adding a light. With hundreds of lamps, a fixed handful of real lights goes to the nearest ones and the rest are faked (lamp lights).
- (default) Many GPU widgets share one device and one submit. A page of sparklines, gauges and glowing cards runs one device, one encoder and one submit a frame. Each widget sleeps on its own: when it is idle, when it is scrolled out of view, and while the tab is hidden. With nothing awake, the loop stops. A lost device drops the widgets to CSS and asks for a new device (GPU page runtime).
- (default) Walk the matrices once a frame. three brings every matrix in the scene up to date on each
render()call. Turn that off (scene.matrixWorldAutoUpdate = false) and callscene.updateMatrixWorld()yourself, once, just before drawing. Objects that never move can leave the walk altogether. - (default) One draw call for identical parts. Hundreds of small rigid parts cost a draw call each in every pass; automatic instancing batches identical ones behind the scene's back, with no change to the code that builds it (its demo town: about 4,900 draws a frame down to 83).
- (default) A store's snapshot stays the same object until it changes. React's
useSyncExternalStorecompares snapshots by identity, so agetSnapshotthat builds a fresh object on every call reads as a change every time, and the component renders again and again. Keep the last value and replace it only when the store tells its listeners.
Tried on the game. One matrix walk a frame, together with merging the test area's boxes by material, took a frame from 953 draws to about 150, and the CPU's frame from 6.1 to about 1.8 ms (median, 1920×1080).
Tried on a shared-list app. Its appearance store's
get()built a new object on each call. The hook now reads a copy kept in a variable, which the store's ownsubscribereplaces when the appearance changes.
Ration in Hz, not in frames
Some work is worth doing less often for things far away or small on screen, such as posing a body's skeleton. Count that rate on the fixed simulation clock and name it in Hz. "Every 2nd frame" is 30 poses a second on a 60 Hz screen and 72 on a 144 Hz one, so the cost and the look change with the display. Ration only the drawing, never the simulation, and stagger the bodies, so they don't all pose on the same frame.
Tried on the game. A body costs about 45 µs a frame, and 94 to 96% of that is the pose; the simulation tick is 2 µs. So near bodies pose every 60 Hz tick, the next tier every third tick (20 Hz, about 17 µs a body) and far ones every twelfth (5 Hz, about 5 µs). Every body still walks exactly as far, because the gait runs 60 times a second whatever the tier. Below about 20 Hz the arms stop reading as swinging, and at 20 Hz a planted foot slides about 8 cm on a stroll before it is put right.
Time on the frame clock, read layout once
A page that draws on the GPU behind its DOM has two clocks and two pictures to keep in step. Two habits do it.
- (default) Wait on frames, not timers. Time a sequence's steps ("the lid lifts, 260 ms later the bow ties") with a wait that checks
performance.now()on eachrequestAnimationFrameand resolves on the first frame past the mark, not withsetTimeout. A timer fires between frames, whenever the main thread is free, and the browser may throttle it hard: in a hidden tab, in a chain of nested timers, on a busy page. Then a step lands a frame early or late against what the GPU draws, or runs while no frame is drawn at all, and the page comes back with a jump. On the frame clock each step lands on a frame, and the sequence pauses with the page. Give every wait a cancel, and cancel a screen's waits when it closes; under reduced motion make them zero. - (always) Keep timers for what must finish. A frame wait never resolves in a hidden tab, so saving, sending and anything a person is waiting for stays on timers or promises, or a person's work is never saved while the tab is hidden.
- (default) Read layout in one batch, after the DOM has settled. Whatever moves the panels (a new screen, a theme, a resize, an opened card, fonts arriving) asks for a layout pass instead of reading rectangles itself. Requests merge until the pass runs, their options together ("re-string the lights" wins over "just move them"). The pass runs once, two frames later, when the new DOM has been laid out and drawn once. It reads every
getBoundingClientRectin one go, then hands the rectangles to the GPU. Reads mixed with writes force a layout for each read; a batch costs one. - (default) Skip the expensive part when nothing moved. Key the rectangles (rounded to whole pixels) and compare with the last pass: equal, and only the cheap update runs. Wait for a resize to stop (about 150 ms) before asking for the pass.
The tilted DOM entry reads its rectangles this way, and the GPU page runtime sleeps widgets that nothing changed.
Tried on the UI mock-ups. Several looks draw on one WebGPU canvas behind their DOM panels: lights strung round the panels, vines along them, glows. One look's waits and timers all run on the frame clock (
wait(ms)andlater(ms, fn), which returns its cancel), so an unwrapping whose steps are 260, 120, 420 and 900 ms apart stays on its frames; under reduced motion its waits are zero or the flourish is skipped. Its onequeueLayout(options)merges requests, runs two frames later and re-strings the lights only when a panel's rounded position or width changed; anything else just moves them. A sibling look runs the same pass again whendocument.fonts.readyresolves, since late fonts move every panel; two others queue it on scroll and from aResizeObserveras well.
Measure honestly
- (default) Name the setup: GPU, CPU, browser, power plan, resolution and pixel ratio. Every cost file in this library starts with that block.
- (default) Compare only within one sitting. One demo here measured anywhere from 1.3 to 6.1 ms from one sitting to another as the laptop warmed, so the library re-measures everything it compares in a single sitting.
- (default) Time the GPU on the GPU, with timestamp queries. The CPU's clock only sees when work was handed over.
- (default) Counts aren't milliseconds. A change that saves 17 draw calls is reported as 17 draw calls until someone has timed it.
- (default) Measure on a quiet machine, with nothing else building, testing or indexing at the same time.
- (default) Draw a measured frame exactly as a real one. A bench that drives its own loop must do every step the real loop does. three advances its node frame (what runs
pass(),rtt()and bloom once a frame) only insidesetAnimationLoop. This library's bench drew outside that loop, so those passes ran one frame in seven and post-processing read three to four times too cheap. Afterwards, check the draw count: it should be the same every frame.
Tried here. Every entry's demo is measured headless over 600 frames, three rounds on fresh pages, keeping the median round. The badges are light under 0.5 ms a frame, moderate up to 2 ms and heavy above, taking the worse of GPU and CPU.
A gate for each scenario
A gate is a script that plays the app the same way every time, measures it and fails when a budget breaks. One number for the whole app hides where the time went, so give each scenario its own budget: running through a village, standing in a herd, driving, a fight.
- (default) A p95, a worst frame and a hitch count for each scenario. Uncap the frame rate while measuring, so the p95 is what a frame costs rather than the display's rounding: at 144 Hz a 7.2 ms frame shows as 13.9.
- (default) Check the machine as well as the app. Time a fixed CPU loop before and after the run, and note how long pages took to load. A slow loop means the laptop is hot or on a low power plan, and the run's numbers don't compare with the last one. Note too when other programs already hold a lot of GPU memory.
- (default) A/B by environment variable. Let the same gate run with one thing changed: a graphics setting, or a line of script that switches one system off before the scenario starts. Two runs that differ only in that variable say what the system costs.
- (default) Compare with the last run. Report each scenario's and each system's time beside the last run of the same route, and flag anything slower by more than a set share and a set amount.
Tried on the game. Its gate runs five scenarios, each with its own p95, worst frame and hitch budget (a hitch is a frame over 34 ms). A hot laptop with its vents blocked once measured every scenario about 50% slower and took about 70 s to load each instead of 50; the same code was fast again once it cooled, which is why the CPU loop is there. Its successor flags any step or system that got 15% and 0.1 ms slower than the last run.
Replay what people do
A frame budget met while the app sits still says little about the moment someone presses a key. Script what a person does, at their pace, and label every frame with what was on screen and how long since the last press. A hitch then points at what caused it.
Tried on a slide-deck app. A harness opens the exported deck in headless Chrome on the real GPU, records every frame from the first paint, and presents it like a presenter: a press every 1.8 s, each slide held until its entrances finish. Optionally it slows the CPU fourfold, for a weaker laptop, or records a trace that lists the longest events on every thread, which is where a hitch with no long task on the page comes from. It found stalls of 70 to 400 ms the first time slides 2, 3, 4, 6 and 9 showed: the browser compiling its own shaders and drawing each slide for the first time. Warming the slides at opacity 0 had drawn nothing. Warmed drawn at a sliver of opacity, presenting had no frame over 21 ms at 144 Hz, and at a quarter of the CPU's speed it stayed at 100 to 135 frames a second with a few frames of 35 to 80 ms.
three.js, version by version
These changed under real projects. Check them again when three moves on.
- r187: a light's node belongs to its class. To change how a kind of light shades, say a sun dimmed under passing clouds, register the node on the light class (
DirectionalLight.registerNode(…)). It then holds for every renderer on the page, once; up to r185 each renderer kept its own map. - r186 and later: WebGPU has no
PCFSoftShadowMap. Asking for it falls back toPCFShadowMapwith a warning, and every material that samples a shadow builds again (GPU foliage found that). Ask for PCF, and soften withshadow.radiusor with a filter node of your own on each shadow. - r185: don't turn a light's
castShadowoff while running. Its shadow node goes on reading the shadow map that was just disposed, and every frame throws. Leave the light casting; with no casters its map is empty and cheap. Turn casting off on the objects instead.
Tried here. Two of this library's demos still asked for
PCFSoftShadowMapafter the move to r187 and got plain PCF with a warning; they now ask for PCF.
As of November 2026: WebGPU timestamp queries need the optional
timestamp-queryfeature, which not every browser and graphics adapter offers. Check for it. Without it, time the GPU indirectly or not at all, and say which.
Parts that show it
 Systems & tooling
 Systems & tooling
Dynamic resolution on GPU timestamps
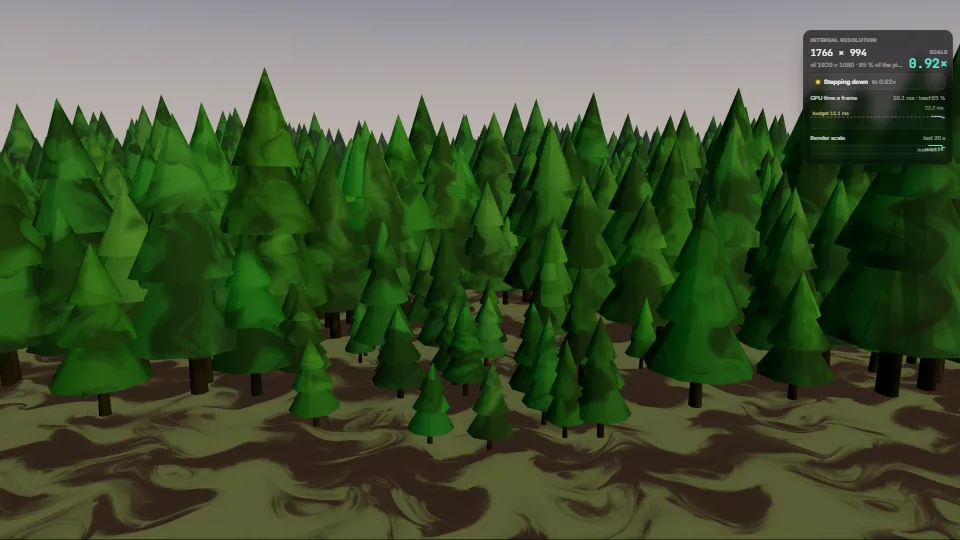
Holds a frame budget by choosing the render scale once a second from the GPU’s own frame times (WebGPU timestamp queries).
 Techniques
Compile without stalls
Shaders and pipelines built ahead, never on the frame that first draws something.
 Canvas & 2D
 Systems & tooling
GPU memory ledger
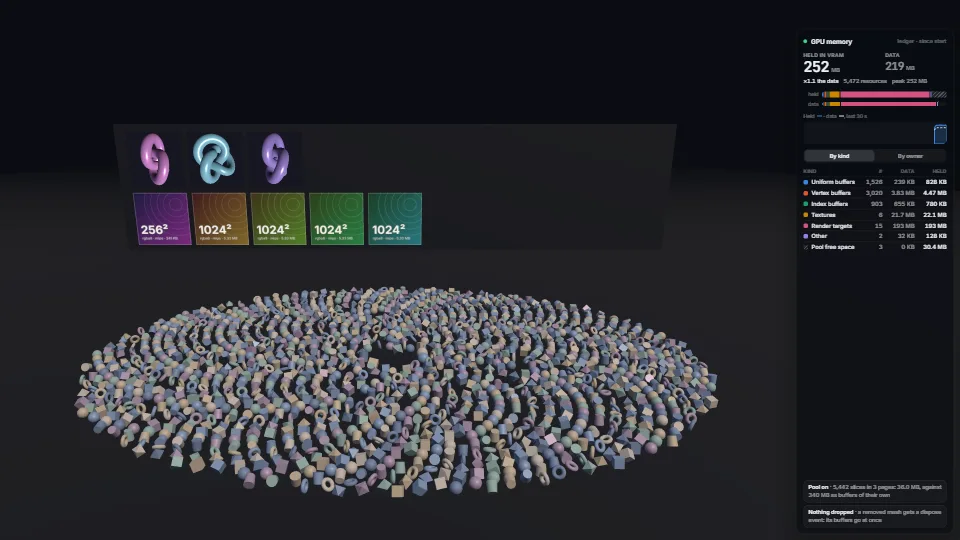
Every GPU byte counted where WebGPU makes it, by kind and owner, held against asked.