 Data & layout
Gauges and progress rings
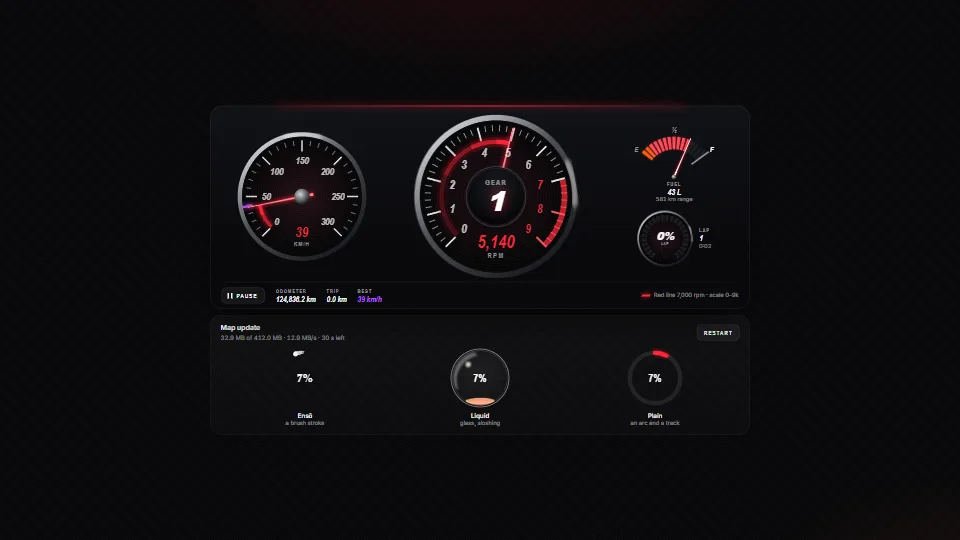
Instrument gauges in SVG (a tach with a red line on a nice scale, a speedometer with a best mark, a fuel gauge and an LED ring) whose needles chase their…
0.35 CPU ms
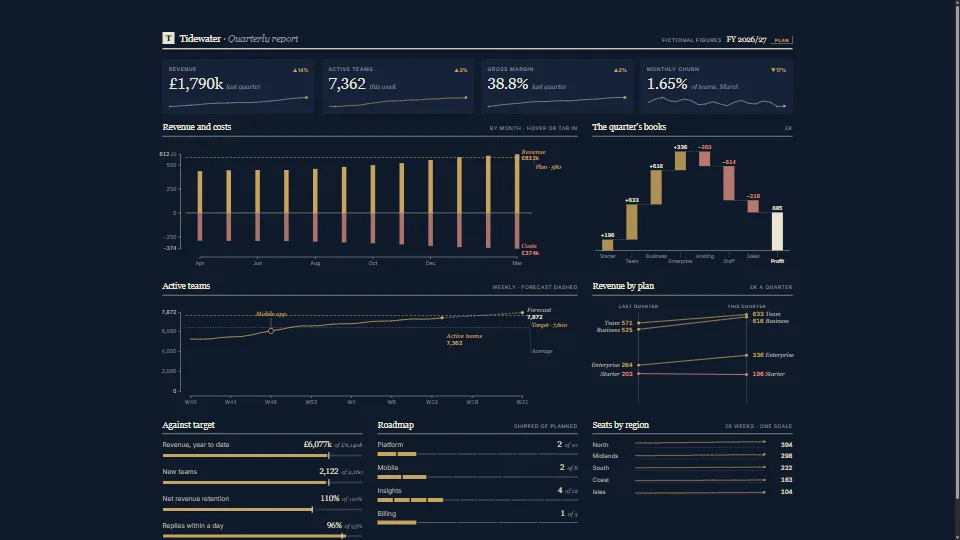
A Tufte-style chart set as plain functions that return SVG.
Measured 7 November 2026 on 13th Gen Intel(R) Core(TM) i9-13900H, Chrome 156, 1920×1080 at 1×. 600 frames × 3 rounds, median kept. What ran: Measured while the data cycles: every frame redraws one of the eleven panels (SVG strings and innerHTML, without the draw-in, which reads each stroke’s length once when a chart first appears), moving to the next data set after each full pass. Idle, the charts cost nothing a frame. Phones: tiers are being measured next.
| Machine | GPU ms | CPU ms | CPU p95 |
|---|---|---|---|
| unknown GPU · 13th Gen Intel(R) Core(TM) i9-13900Hreference · measuring tool | not timed | 0.34 | 1.02 |
| apple · Apple A19 Proin a browser tab · 16 November 2026 | not timed | 1.22 | 3.24 |
| Intel Arc 140V (Xe2-LPG) · Intel Core Ultra 7 258Vin a browser tab · 15 November 2026 | not timed | 0.68 | 2.17 |
Bars against one 16.7 ms frame. A browser-tab run is timed in a visible tab without the tool’s scripted input, so read it as close, not exact.
right px for the direct labels: on a narrow chart drop it to about 74, or long labels run off the edge.From HaTac. Fully custom code.
Edward Tufte, The Visual Display of Quantitative Information and Beautiful Evidence: Range frames, sparklines, slope graphs, direct labels and the least ink that carries the data: the design ideas, no code.
Stephen Few, Bullet Graph Design Specification (2006): The bullet graph: qualitative bands, the measure as a bar, the target as a tick.
Paul Heckbert, “Nice Numbers for Graph Labels”, Graphics Gems (1990): niceTicks follows the idea of rounding the tick step to 1, 2 or 5 times a power of ten (here with 2.5 added); the code is the owner’s.
Data & layoutInstrument gauges in SVG (a tach with a red line on a nice scale, a speedometer with a best mark, a fuel gauge and an LED ring) whose needles chase their…
 Data & layout
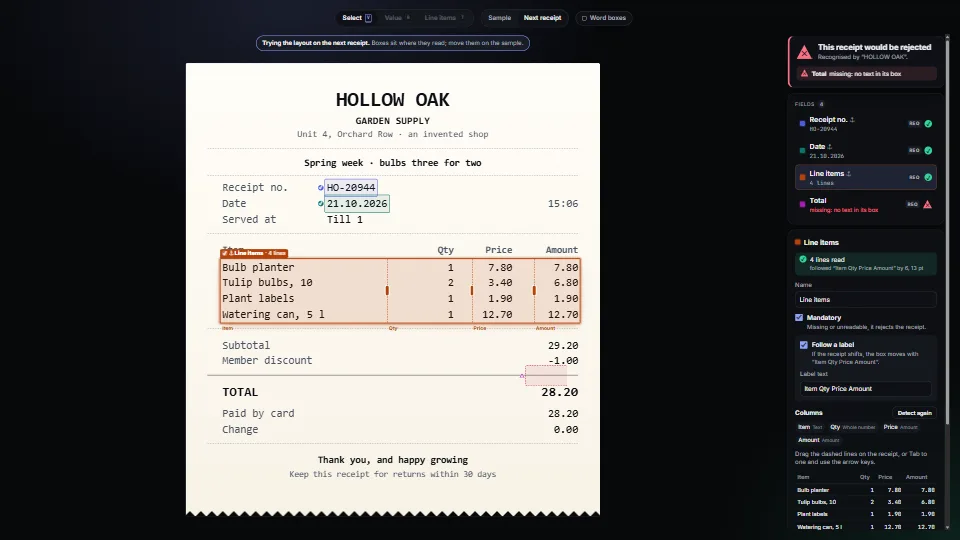
Map where each value sits on a PDF or a scan with a text layer, from nothing but its words and their boxes.
 Data & layout
 Data & layout
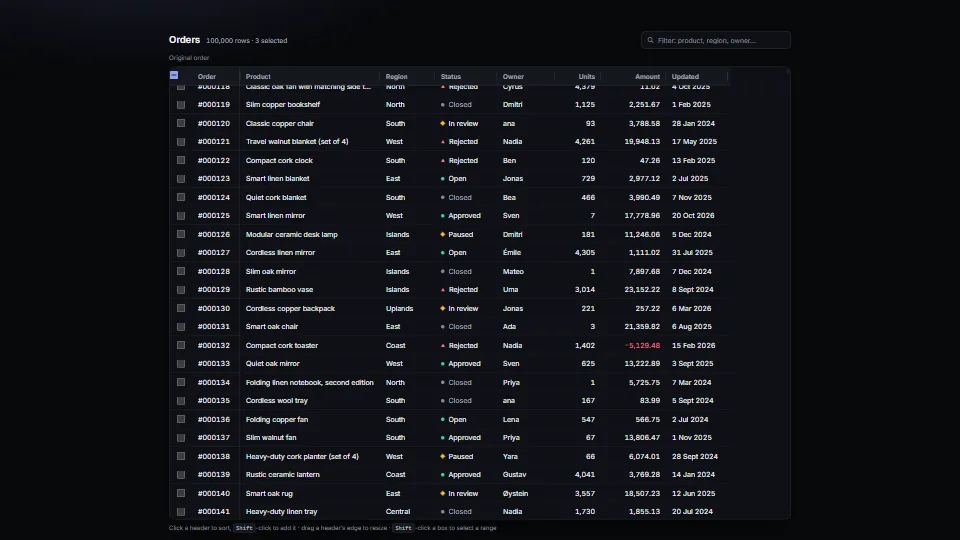
A real <table> that holds up with 100,000 rows.