 Data & layout
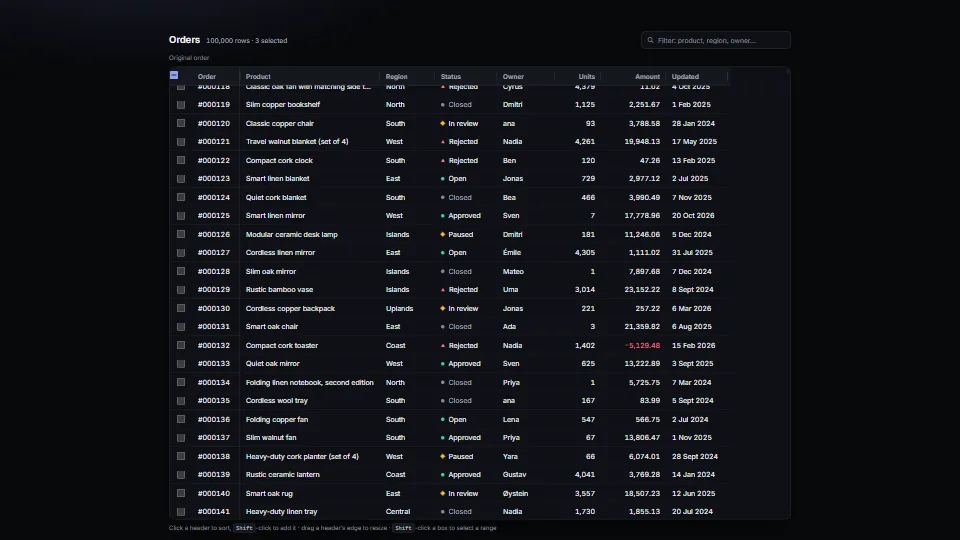
Data table: sort, sticky header, virtual rows
A real <table> that holds up with 100,000 rows.
0.22 CPU ms
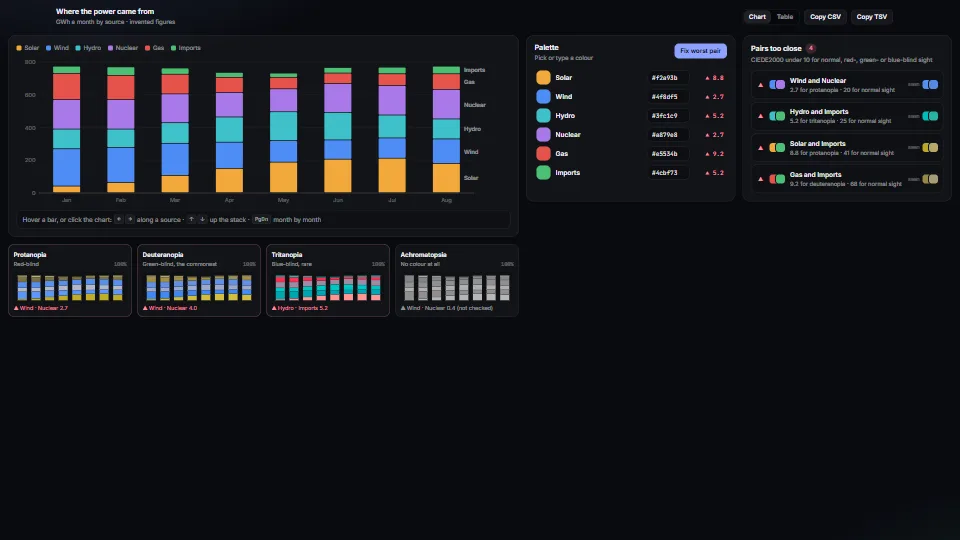
An accessibility kit for charts and data views.
Measured 3 November 2026 on 13th Gen Intel(R) Core(TM) i9-13900H, Chrome 156, 1920×1080 at 1×. 600 frames × 3 rounds, median kept. What ran: Measured with the palette check (every pair of six colours under four visions, CIEDE2000) and the four simulated charts recomputed every frame. Live they run only when a colour or a control changes, so an idle chart costs nothing. Phones: tiers are being measured next.
| Machine | GPU ms | CPU ms | CPU p95 |
|---|---|---|---|
| unknown GPU · 13th Gen Intel(R) Core(TM) i9-13900Hreference · measuring tool | not timed | 0.24 | 0.39 |
| apple · Apple A19 Proin a browser tab · 16 November 2026 | not timed | 0.40 | 0.44 |
| Intel Arc 140V (Xe2-LPG) · Intel Core Ultra 7 258Vin a browser tab · 15 November 2026 | not timed | 0.42 | 0.57 |
Bars against one 16.7 ms frame. A browser-tab run is timed in a visible tab without the tool’s scripted input, so read it as close, not exact.
From SpaciousPro. Fully custom code.
Machado, Oliveira and Fernandes, “A Physiologically-based Model for Simulation of Color Vision Deficiency” (IEEE TVCG, 2009): The protan, deutan and tritan matrices are the paper’s, at full severity, applied in linear RGB. Lower severities blend toward them (an approximation of the paper’s tabulated steps).
CIE 142-2001, CIEDE2000 colour difference; Sharma, Wu and Dalal, “The CIEDE2000 color-difference formula: implementation notes” (2005): deltaE00 is the published formula, written from the standard; its mean hue and hue difference follow the implementation notes, and it gives their test data’s values to four decimals.
Masataka Okabe and Kei Ito, Color Universal Design (2008): The demo’s “Okabe & Ito” preset is six colours of their palette.
W3C WCAG 2: Use of Color (1.4.1) and Non-text Contrast: The rule the kit serves: never colour alone. Guidance, no code.
Data & layoutA real <table> that holds up with 100,000 rows.
 Data & layout
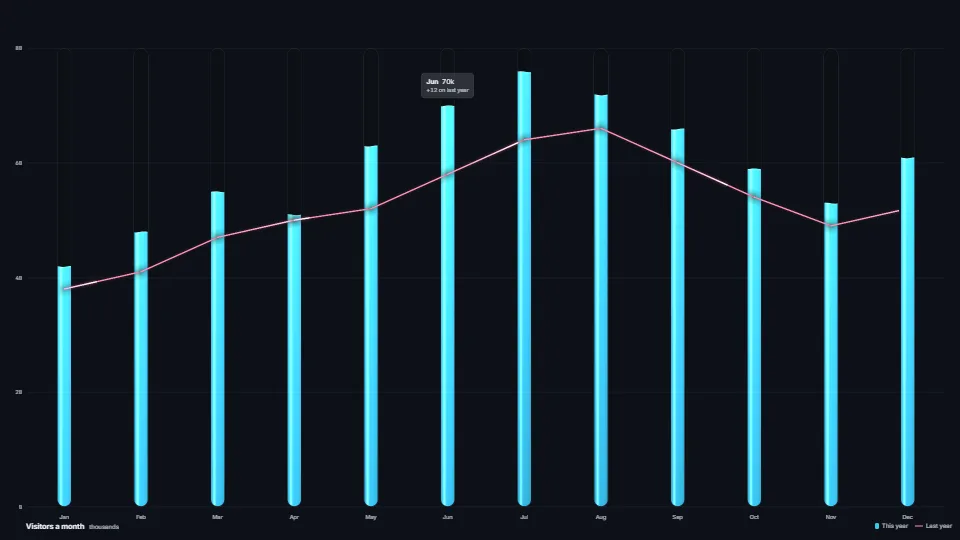
Bars and lines drawn as physical things in one instanced draw each.
 Data & layout
 Data & layout
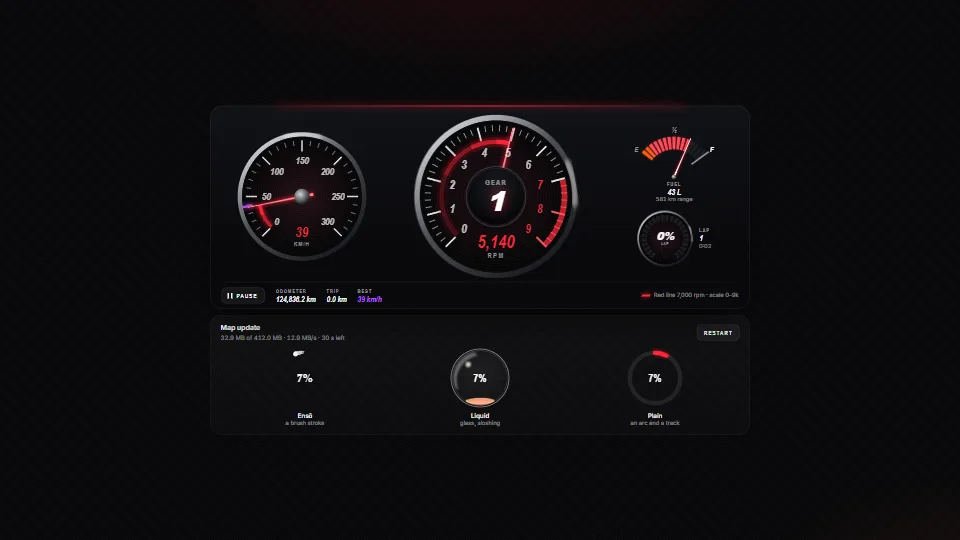
Instrument gauges in SVG (a tach with a red line on a nice scale, a speedometer with a best mark, a fuel gauge and an LED ring) whose needles chase their…