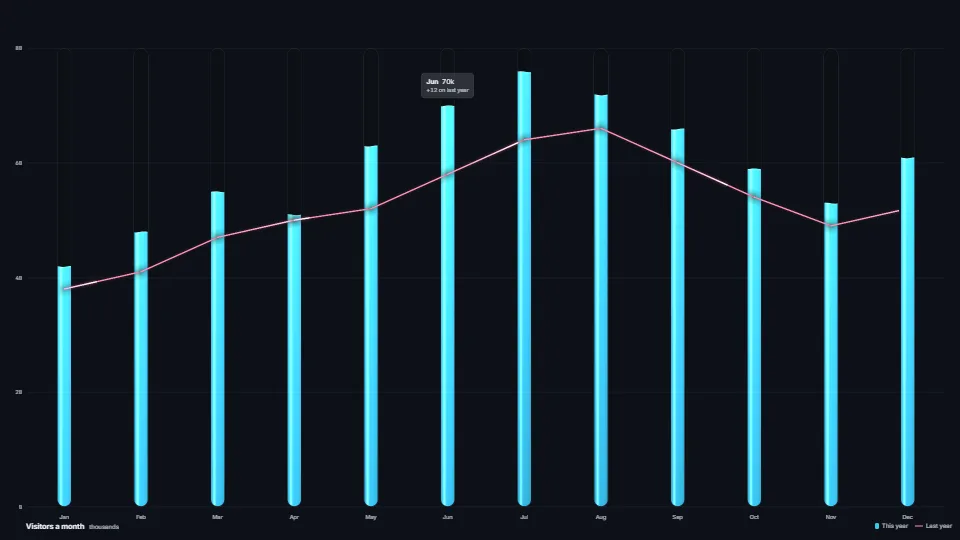
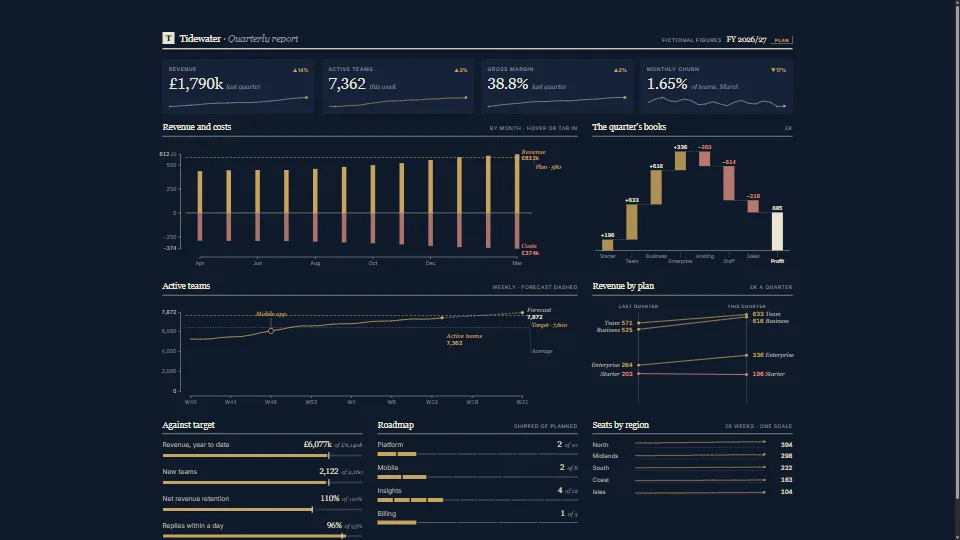
The live demo starts when it’s in view.Pick a look · hover or tap a month for its figures · Charts: Two, linked lights the month on both · Add a month runs the line on from its end · Tab to a chart and use the arrow keys
Bars and lines drawn as physical things in one instanced draw each.
What it costs a frame
GPU
0.04 ms
CPU
0.20 ms
02468101216.7 ms
GPU
0.04 ms
CPU, median
0.20 ms
CPU, 95th pct
0.35 ms
Draw calls
4
Weight
Light
Measured 4 November 2026 on RTX 4060 Laptop, 13th Gen Intel(R) Core(TM) i9-13900H, Chrome 156, 1920×1080 at 1×. 600 frames × 3 rounds, median kept. What ran: The default look (glass capsules and the glowing line) at rest, growing in again every 2.5 s while the highlight sweeps across the months. Phones: tiers are being measured next.
apple · Apple A19 Proin a browser tab · 16 November 2026
0.92
0.10
0.24
Intel Arc 140V (Xe2-LPG) · Intel Core Ultra 7 258Vin a browser tab · 15 November 2026
0.13
0.34
0.47
Bars against one 16.7 ms frame. A browser-tab run is timed in a visible tab without the tool’s scripted input, so read it as close, not exact.
What it needs
Renders with
WebGPUNeeds WebGPU: current Chrome and Edge, Safari 26+, Firefox 141+ on Windows.
Your browser
Checking…Looking for WebGPU
Depends on
three.js 0.187.0No other packages
What it’s for
Dashboards with character
Hero figures on a landing page
Reports and year reviews
Games’ stats screens
Canvas and whiteboard apps
Live charts where points keep arriving
Linked charts and tables
Pitfalls, in brief
The looks are authored in display colour, as on a 2D canvas.
Each look is its own pair of shaders, built the first time it is used: compile() the looks you will switch to ahead of time, or the first frame in a new look stalls while it builds.
The quill shaders take derivatives (fwidth) to filter their barbs: call them for every pixel and cut the result afterwards, never inside a branch, or the shader will not compile.
set() compares each owner’s marks with its last: only changed marks grow in.
Halos, spikes, leaves and the pour reach past a bar’s rect (up to 30 px); the glass look’s glow and floor pool reach about 75 px with its defaults (glassReach in glass.ts says how far): leave room round the plot, or they are cut at the stage’s edge.
7 more in brief
three multiplies a premultipliedAlpha material’s colorNode by its opacity again.
A line given more points draws on from its old end only when its old points are exactly its first ones.
Two charts linked by the app (two instances, a chart and a table) must pass hover changes on with source ‘api’, and pass on only those that did not come from ‘api’, or each lights the other back for ever.
The camera is orthographic with y down (top < bottom), which mirrors the projection: the materials are double-sided for that reason.
Text stays in the DOM: axis labels, the readout and a table of the figures.
moving is true while marks grow, a hover eases or ambient motion is on: a render-on-demand app can stop drawing once it is false.
The demo needs WebGPU: every look is written in WGSL (wgslFn, about 750 lines across the nine looks and wgsl-common.ts), which three’s WebGL2 backend cannot compile (it fails with a shader error at fn).
12 pitfalls in full, the hook-up guide, the module source and its tests come with the part.
Where it comes from
From SpaciousPro. Fully custom code.
Inigo Quilez, 2D distance functions: The rounded bars, the glass capsule and the glass bars use his sdRoundBox; the greenhouse leaf is his sdVesica. Kept as they were ported, with this credit.
Mark Jarzynski and Marc Olano, “Hash Functions for GPU Rendering” (JCGT, 2020): The PCG hash under the value noise and the glass patterns, in place of the sine hashes the sources used.
Rosensweig instability: The spikes on the ferrofluid columns imitate the peaks a ferrofluid forms in a magnetic field.
One zoomable sheet of rows × days, from three years of a whole organisation down to the records of one hour, where every pixel shows the true total of what it covers.
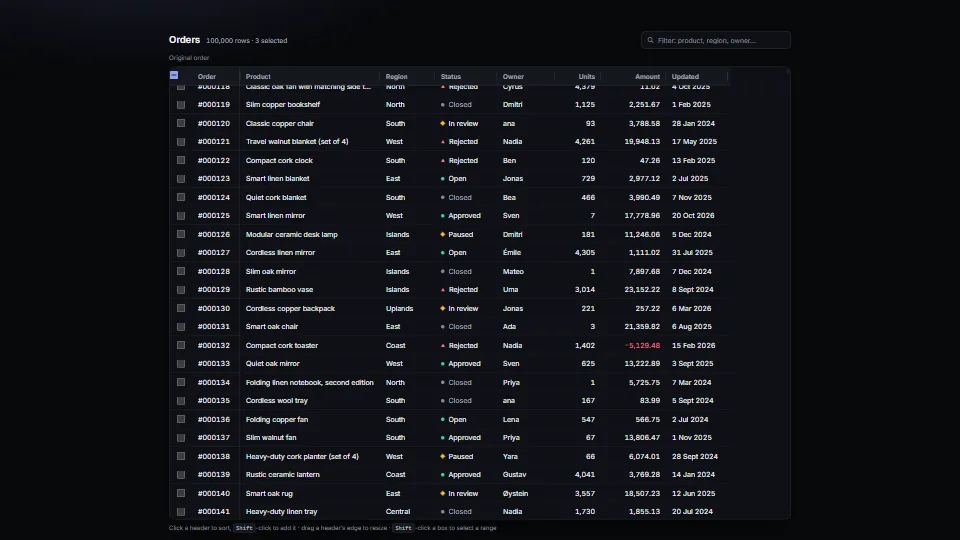 Data & layout
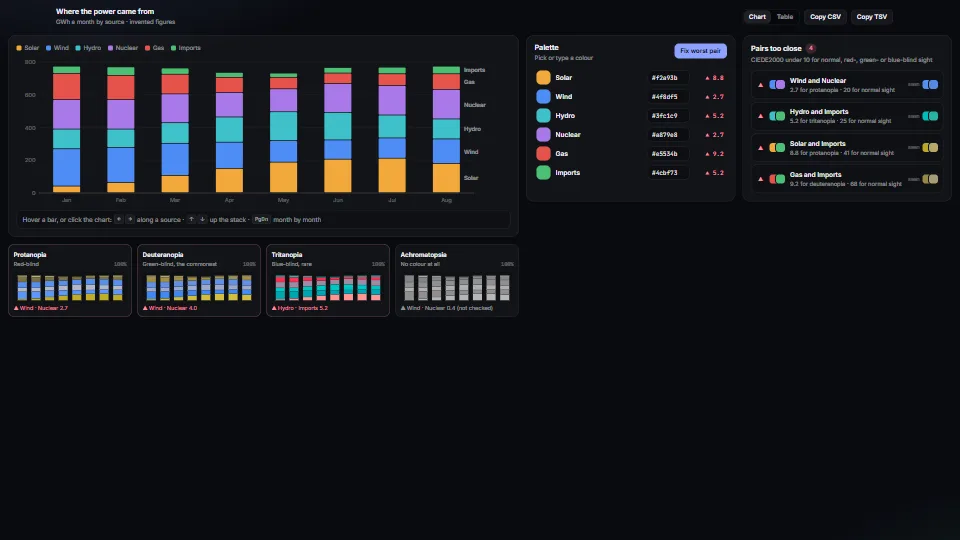 Data & layout
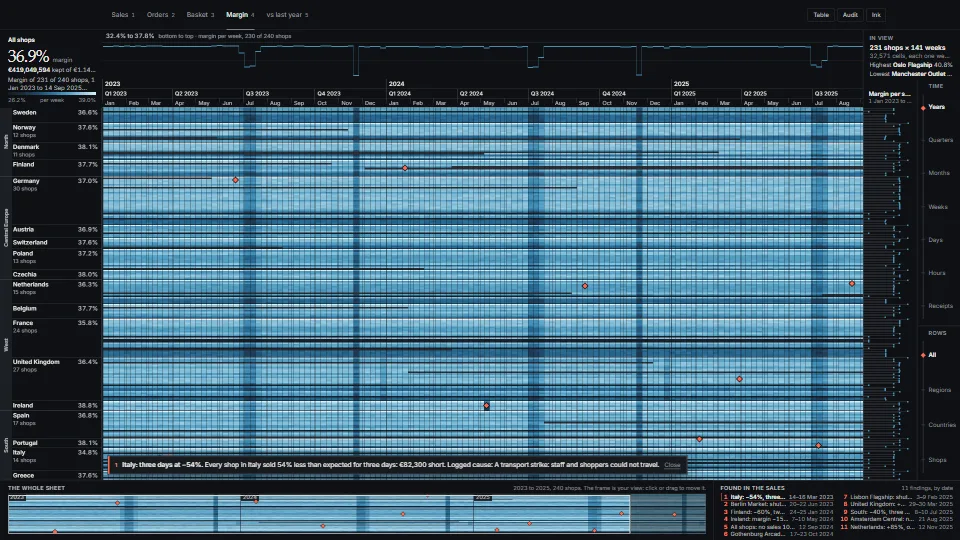 Data & layout
 Data & layout