Feature Library

A sheet that adds up at any zoom

0.12 GPU · <0.01 CPU ms
A still of the A sheet that adds up at any zoom demo
Still
The live demo starts when it’s in view.Wheel or pinch to zoom · drag to pan · click pins, a second pin compares · double-click dives · a finding flies there · arrows, + − and Enter on the sheet · G edits the export’s columns

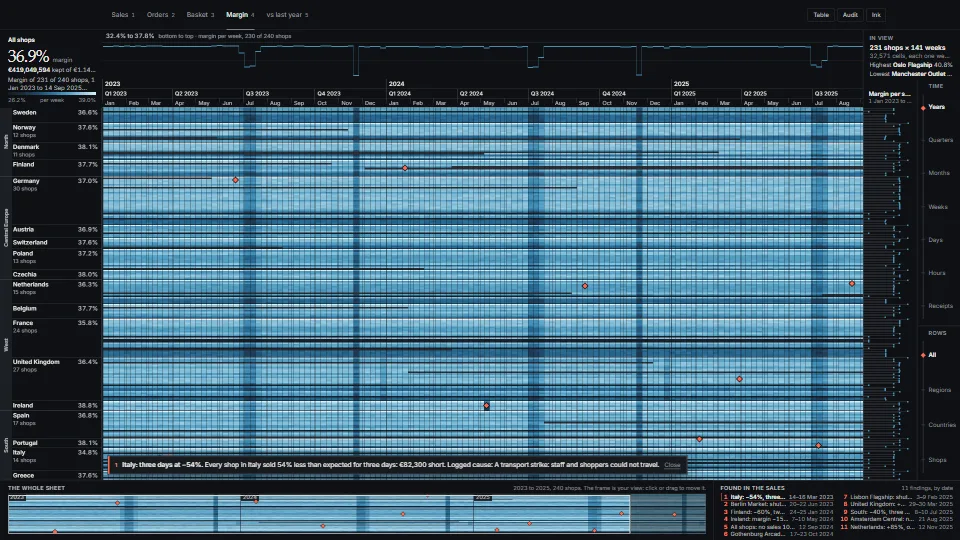
One zoomable sheet of rows × days, from three years of a whole organisation down to the records of one hour, where every pixel shows the true total of what it covers.

What it costs a frame

0.12 ms
<0.01 ms
GPU
0.12 ms
CPU, median
<0.01 ms
CPU, 95th pct
0.01 ms
Draw calls
0
Weight
Light

Measured 10 November 2026 on 13th Gen Intel(R) Core(TM) i9-13900H, Chrome 157, 1920×1080 at 1×. 600 frames × 3 rounds, median kept. What ran: Measured flying from finding to finding (a flight every 2.4 s, through every altitude down to hours), 240 shops × 1,096 days in view at the top: the sheet shader reads the prefix sums for every pixel, plus the text and mark layers. Phones: tiers are being measured next.

On every machine it was measured on
MachineGPU msCPU msCPU p95
unknown GPU · 13th Gen Intel(R) Core(TM) i9-13900Hreference · measuring tool0.12<0.010.01
apple · Apple A19 Proin a browser tab · 16 November 20266.99<0.010.02
Intel Arc 140V (Xe2-LPG) · Intel Core Ultra 7 258Vin a browser tab · 15 November 20260.52<0.01<0.01

Bars against one 16.7 ms frame. A browser-tab run is timed in a visible tab without the tool’s scripted input, so read it as close, not exact.

How steadily it runs on Intel Arc 140V (Xe2-LPG) · Intel Core Ultra 7 258V · in a browser tab

Typical frame ?
16.61 ms
1% low ?
36 fps
Varies by ?
±1.34 ms
All metricsIntel Arc 140V (Xe2-LPG) · Intel Core Ultra 7 258V · in a browser tab
p50p95p9916.02 ms28.45 ms +
How long each frame took. Most frames sit in the tall bars; a long tail to the right is hitching.

Frames run on a 60 Hz timer (a page demo), so most frames take about one tick, 16.7 ms: the spread around it is what matters.

Frames

Median (p50) ?
16.61 ms
p95 ?
17.79 ms
p99 ?
24.79 ms
Slowest ?
32.59 ms
Mean ?
16.84 ms
Standard deviation ?
1.34 ms
1% low ?
36 fps
0.1% low ?
31 fps
Hitches ?
0 of 600
Over budget ?
5 of 600

Main thread

Long tasks ?
0
Long frames ?
0
Event-loop delay ?
0.0 / 4.9 / 11.7 ms

Input

No input during this run. A browser-tab run plays none.

Memory

JavaScript heap ?
139 → 156 MB
Growth ?
+16.98 MB

What it needs

Renders with
WebGPUNeeds WebGPU: current Chrome and Edge, Safari 26+, Firefox 141+ on Windows.
Your browser
Checking…Looking for WebGPU
Depends on
NothingNo other packages

What it’s for

  1. Sales or usage by place and day
  2. Drill-down from years to single records
  3. Figures that must agree to the cent
  4. Incidents found in many time series
  5. A rows × days grid too big for a DOM table
  6. A spreadsheet template whose columns people rearrange

Pitfalls, in brief

  1. The GPU sums are unsigned 32-bit, modulo 2^32: a box is exact while that box’s own total is below 2^32 (the shader only ever sums one row over a span). gpuExact(grid) says whether your data qualifies; money in cents passes up to about €42.9M per row over the whole sheet.
  2. Channels are integers.
  3. The fine split (hours) must add up to its cell exactly: use splitInt (largest remainders), never Math.round on each part.
  4. Every leaf of the row tree must sit at the same depth; the two levels above the rows are drawn as bands and groups, with their own lines.
  5. Columns are days and at most 65,535 (the bounds texture packs start and end into 16 bits each); the hour window holds 32 days at a time and opens three per frame, so a deep dive shows each day’s own value for a frame or two.
7 more in brief
  1. Lay the regions out in CSS and keep them over the canvas: the module reads their boxes on resize (ResizeObserver) and draws in them.
  2. Nothing draws while nothing changes: call invalidate() after you change anything the sheet does not know about. settle() resolves when it is still again.
  3. Text is drawn by the GPU in the font you pass: give it the same family the page uses, loaded; the atlas is rebuilt once web fonts arrive and when the pixel ratio changes.
  4. Without WebGPU createZoomSheet resolves to null: show renderFallback, which writes the same figures as a chart and a table from the same sums.
  5. remapFormula reads A1-style references written in capitals (a spreadsheet stores them so).
  6. Remap every formula with the same map, before you splice the columns themselves: the map speaks of the old positions. remapMerges needs the sheet’s width before the edit, to tell a column moved in between a block’s columns from a new one inserted there.
  7. The detector reads the whole history of every node (a few hundred milliseconds for 240 rows × 1,096 days): run it once, before the sheet shows, or in a worker.
12 pitfalls in full, the hook-up guide, the module source and its tests come with the part.

Where it comes from

From HaTac. Fully custom code.

Franklin C. Crow, Summed-Area Tables for Texture Mapping (SIGGRAPH 1984): The 2D prefix sums that make any box’s total four lookups, on the CPU and in the sheet shader.

Jarke J. van Wijk and Wim A. A. Nuij, Smooth and Efficient Zooming and Panning (InfoVis 2003): The optimal zoom-and-pan path every flight follows (camera.ts zoomPath), one per axis on one clock.

Björn Ottosson, Oklab (2020): The colour ramps are interpolated in Oklab, so equal steps in value look equal; its published matrices.

Melissa O’Neill, PCG (2014); Mark Jarzynski and Marc Olano, Hash Functions for GPU Rendering (2020): The audit’s seeded sampler and the demo data’s integer hash.

Frank R. Hampel, the median absolute deviation (1974): The detector’s robust spread: a day is flagged at five scaled MADs from its expectation.

summed-area tableprefix sumszoomableheatmapcalendarlevel of detailsemantic zoomsmooth zoomvan wijk nuijglyph atlasanomaly detectionauditexactraw webgpuwgsldom + gpukeyboardfallbackformulasspreadsheet#REF!merged cellscolumn remap

Near it in the frame