 Data & layout
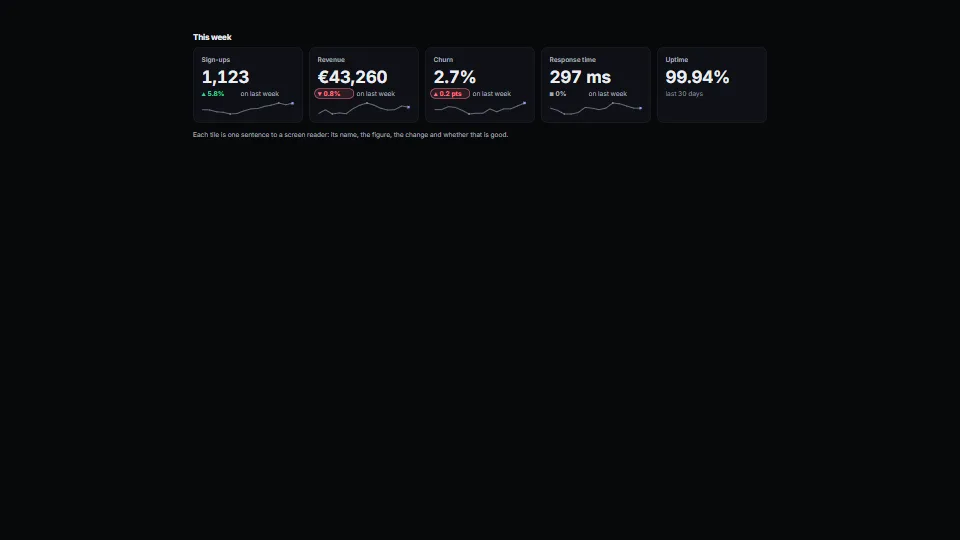
KPI tiles
A row of figure tiles that lines up: each a label, a value at the one size every value in the row shares, a detail line with the change (arrow, figure, period)…
<0.01 CPU ms
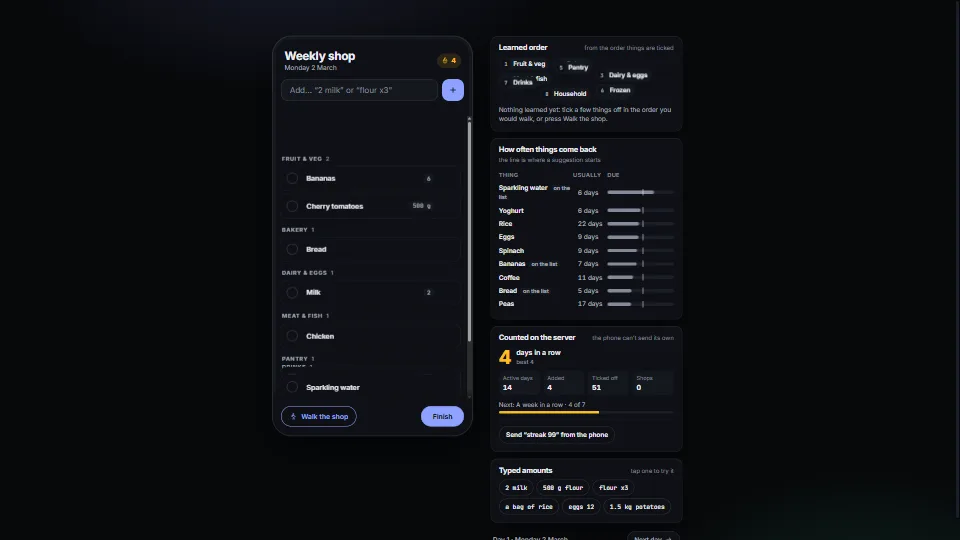
The small smarts that make a shared shopping or packing list feel like it knows you, as pure, tested functions.
Measured 13 November 2026 on RTX 4060 Laptop, 13th Gen Intel(R) Core(TM) i9-13900H, Chrome 157, 1920×1080 at 1×. 600 frames × 3 rounds, median kept (rounds ranged CPU <0.01–<0.01 ms). What ran: Measured with the demo shopping by itself: it adds what is due, walks the shop ticking a row every 250 ms (each tick re-sorts the list with a FLIP move and may learn the order), finishes, and moves to the next day, then starts over after two weeks. The smarts are pure functions of a few dozen records: well under a millisecond each; the cost is the list being drawn again. Phones: tiers are being measured next.
| Machine | GPU ms | CPU ms | CPU p95 |
|---|---|---|---|
| RTX 4060 Laptop · 13th Gen Intel(R) Core(TM) i9-13900Hreference · measuring tool | not timed | <0.01 | <0.01 |
| apple · Apple A19 Proin a browser tab · 16 November 2026 | not timed | <0.01 | <0.01 |
| Intel Arc 140V (Xe2-LPG) · Intel Core Ultra 7 258Vin a browser tab · 15 November 2026 | not timed | <0.01 | <0.01 |
Bars against one 16.7 ms frame. A browser-tab run is timed in a visible tab without the tool’s scripted input, so read it as close, not exact.
From My other apps. Fully custom code.
mulberry32, by Tommy Ettinger (public domain): The repeatable random that makes the demo’s made-up history (demo-data.ts), not the module.
Data & layoutA row of figure tiles that lines up: each a label, a value at the one size every value in the row shares, a detail line with the change (arrow, figure, period)…
 Data & layout
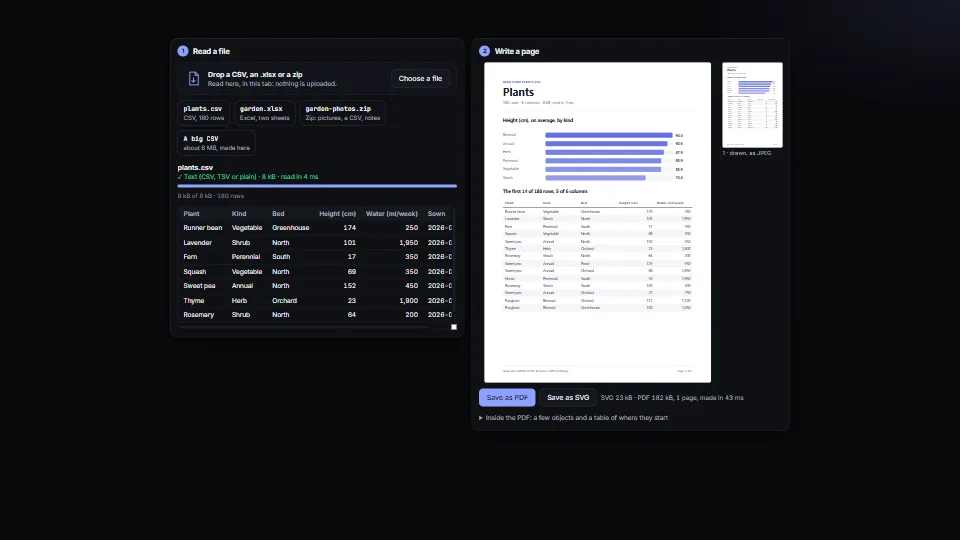
Writes the files an app hands people, in plain TypeScript.
 Data & layout
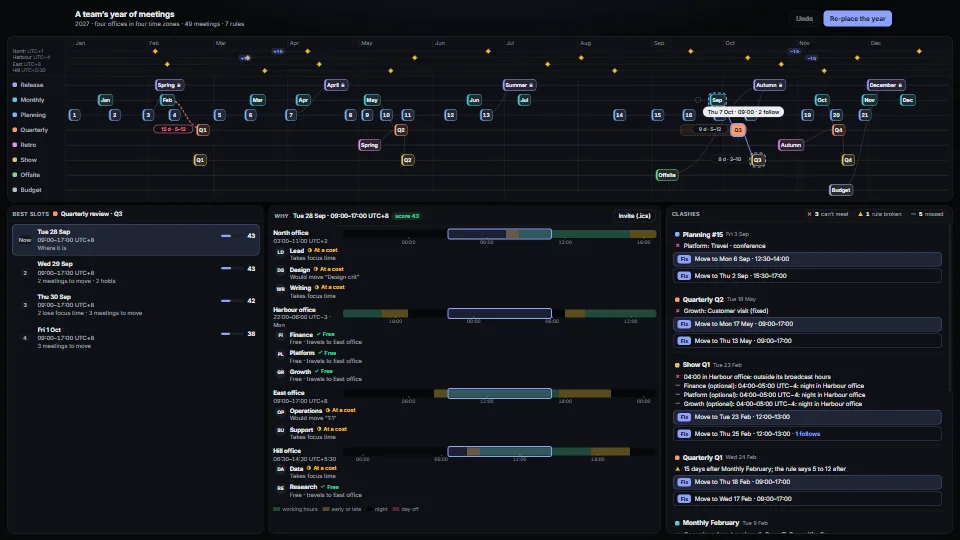
A pure, tested scheduling core for a team spread over offices and time zones.
 Data & layout
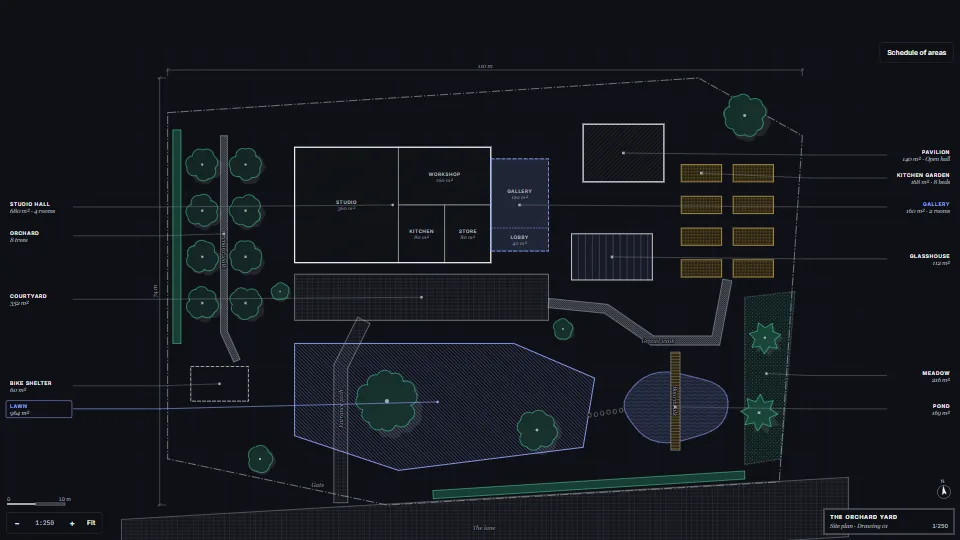
A site plan drawn from plain data in the conventions of an architect’s drawing.