The live demo starts when it’s in view.Watch the figures tick: values change, no tile moves · Switch the locale · Lose the uptime feed, or reload it · A screen reader hears each tile as one sentence
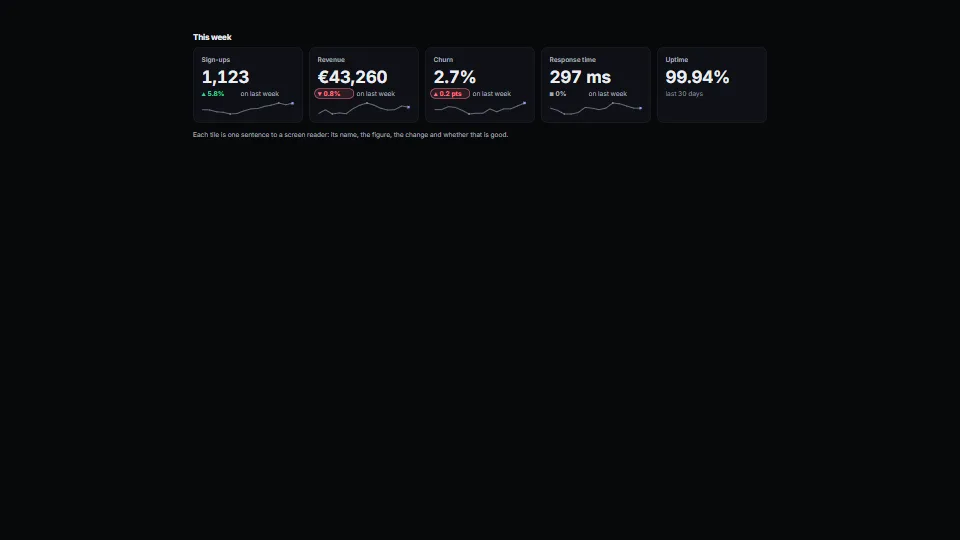
A row of figure tiles that lines up: each a label, a value at the one size every value in the row shares, a detail line with the change (arrow, figure, period)…
What it costs a frame
CPU
<0.01 ms
02468101216.7 ms
GPU
not used
CPU, median
<0.01 ms
CPU, 95th pct
<0.01 ms
Draw calls
0
Weight
Light
Measured 16 November 2026 on RTX 4060 Laptop, 13th Gen Intel(R) Core(TM) i9-13900H, Chrome 157, 1920×1080 at 1×. 600 frames × 3 rounds, median kept (rounds ranged CPU <0.01–<0.01 ms). What ran: Measured with every figure ticking once a second (new values, changes, sentences and sparklines drawn again) in a row of five tiles. Phones: tiers are being measured next.
How steadily it runs on RTX 4060 Laptop · 13th Gen Intel(R) Core(TM) i9-13900H · reference
Typical frame ?
16.70 ms
1% low ?
55 fps
Varies by ?
±0.46 ms
All metricsRTX 4060 Laptop · 13th Gen Intel(R) Core(TM) i9-13900H · referenceHow long each frame took. Most frames sit in the tall bars; a long tail to the right is hitching.
Frames run on a 60 Hz timer (a page demo), so most frames take about one tick, 16.7 ms: the spread around it is what matters.
Frames
Median (p50) ?
16.70 ms
p95 ?
17.60 ms
p99 ?
18.11 ms
Slowest ?
18.59 ms
Mean ?
16.76 ms
Standard deviation ?
0.46 ms
1% low ?
55 fps
0.1% low ?
54 fps
Hitches ?
0 of 600
Over budget ?
0 of 600
Main thread
Long tasks ?
0
Long frames ?
0
Event-loop delay ?
0.0 / 0.2 / 2.2 ms
Input
No input during this run.
Memory
JavaScript heap ?
29.9 → 30.5 MB
Growth ?
+0.61 MB
Browser
JavaScript a frame ?
0.07 ms
All tasks a frame ?
0.14 ms
Layout / style ?
0.01 / 0.00 ms
Main thread busy ?
1%
Garbage collection
Collections ?
1 (1 minor, 0 major)
Pauses ?
2.1 ms in all, longest 0.6
What it needs
Renders with
DOM and CSSPlain DOM and CSS: every current browser.
Your browser
Runs hereNo WebGPU needed
Depends on
NothingNo other packages
What it’s for
The top row of a dashboard
A live board’s figures (sign-ups, wait times, counts left)
A report’s headline numbers
Any row of figures people compare at a glance
Pitfalls, in brief
Give every value in the row one size and one line.
Say which way is better (better: 'down' for errors, churn, wait times).
A percentage’s change is in points (2.1% to 2.4% is “up 0.3 pts”), not a percentage of a percentage (“up 14%”), which most readers misread.
Don’t tell good and worse by colour alone: one reader in twelve can’t tell the green from the red.
The change has one width (--kpi-delta-w, 9ch, about “▼ 12.6%” or “▲ 0.3 pts”) so its period never slides as it updates.
3 more in brief
Keep the detail line even when a figure has no change to show: its room is kept so the sparklines and the next row stay on one line across the tiles.
Pass period as the words after the change (“on last week”, “since yesterday”).
Update in place (update(tiles), matched by id): a re-render that builds new tiles loses a screen reader’s place and redraws every sparkline.
8 pitfalls in full, the hook-up guide, the module source and its tests come with the part.
 Data & layout
 Data & layout
 Data & layout
 Data & layout