 Data & layout
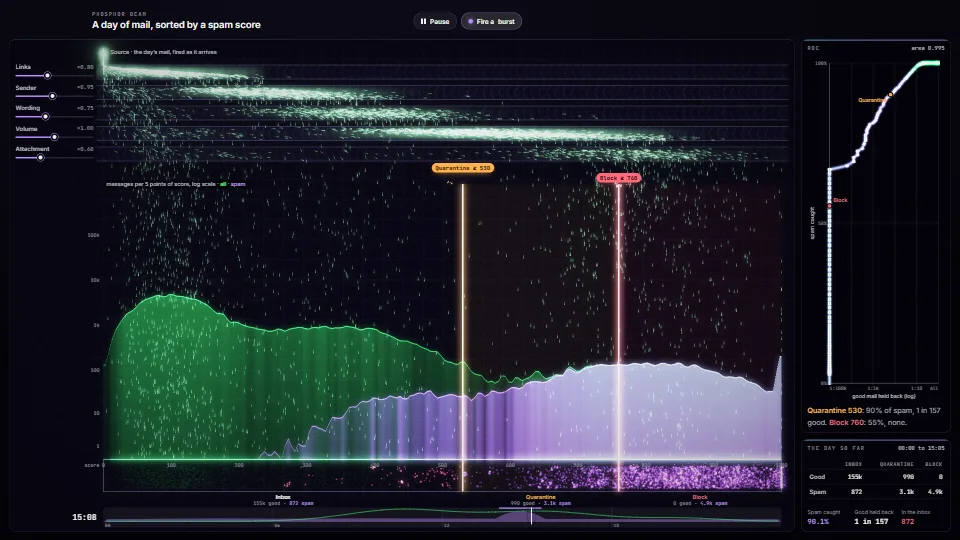
Phosphor beam: scores as a particle beam
A classifier's scores drawn as a particle beam.
1.38 GPU · 0.33 CPU ms
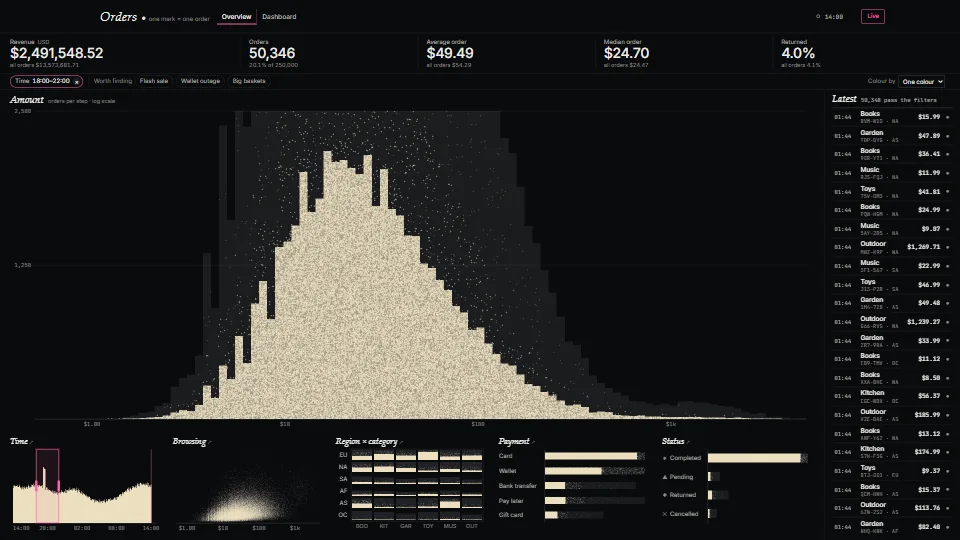
A cross-filtered dashboard where every record is one mark on one WebGPU canvas, up to a million of them.
Measured 11 November 2026 on 13th Gen Intel(R) Core(TM) i9-13900H, Chrome 157, 1920×1080 at 1×. 600 frames × 3 rounds, median kept. What ran: Measured at 250,000 marks in the overview, a time brush sweeping across the day (a cross-filter pass over every order, the eased histograms, and six views of marks redrawn each frame), the large chart changing every 4 s (a flight). Phones: tiers are being measured next.
| Machine | GPU ms | CPU ms | CPU p95 |
|---|---|---|---|
| unknown GPU · 13th Gen Intel(R) Core(TM) i9-13900Hreference · measuring tool | 1.37 | 0.13 | 0.18 |
| apple · Apple A19 Proin a browser tab · 16 November 2026 | 9.80 | 0.30 | 0.46 |
| Intel Arc 140V (Xe2-LPG) · Intel Core Ultra 7 258Vin a browser tab · 15 November 2026 | 15.9 | 0.28 | 0.60 |
Bars against one 16.7 ms frame. A browser-tab run is timed in a visible tab without the tool’s scripted input, so read it as close, not exact.
From HaTac. Fully custom code.
Square, Crossfilter (Mike Bostock and others, 2012): The idea: each chart’s histogram counts the records that pass every other chart’s brush, so a brushed chart still shows what lies outside its brush. Written here from the idea, on the GPU; no code from the library.
Steven Drucker & Roland Fernandez, A unifying framework for animated and interactive unit visualizations (SandDance, Microsoft Research, 2015): One mark per record, moving between layouts.
Deokgun Park, Steven Drucker, Roland Fernandez & Niklas Elmqvist, Atom: a grammar for unit visualizations (2018): Unit charts: a bar made of its records.
Jeffrey Heer & George Robertson, Animated transitions in statistical data graphics (2007): Staged, staggered transitions between charts that keep the viewer’s place.
Chris Wellons, hash prospector (lowbias32): The integer hash that scatters marks inside their bins (public domain).
Tommy Ettinger, Mulberry32: The demo’s seeded generator and the tests’ (public domain).
Ken Perlin, Improving noise (SIGGRAPH 2002): The smootherstep the flights ease with.
Paul Heckbert, Nice numbers for graph labels (Graphics Gems, 1990): Axis tops at 1, 1.2, 1.5, 2, 2.5… times a power of ten.
WAI-ARIA Authoring Practices Guide (W3C): Charts as focusable groups with a role description and their keys in their names; toggle buttons with aria-pressed; a polite live region for what a brush changed.
Data & layoutA classifier's scores drawn as a particle beam.
 Data & layout
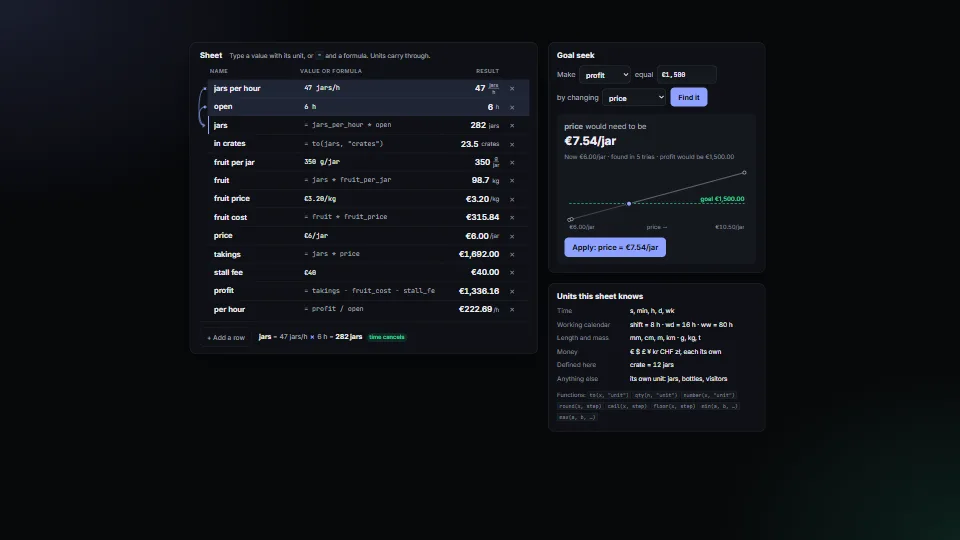
Numbers that keep their units through every step.
 Data & layout
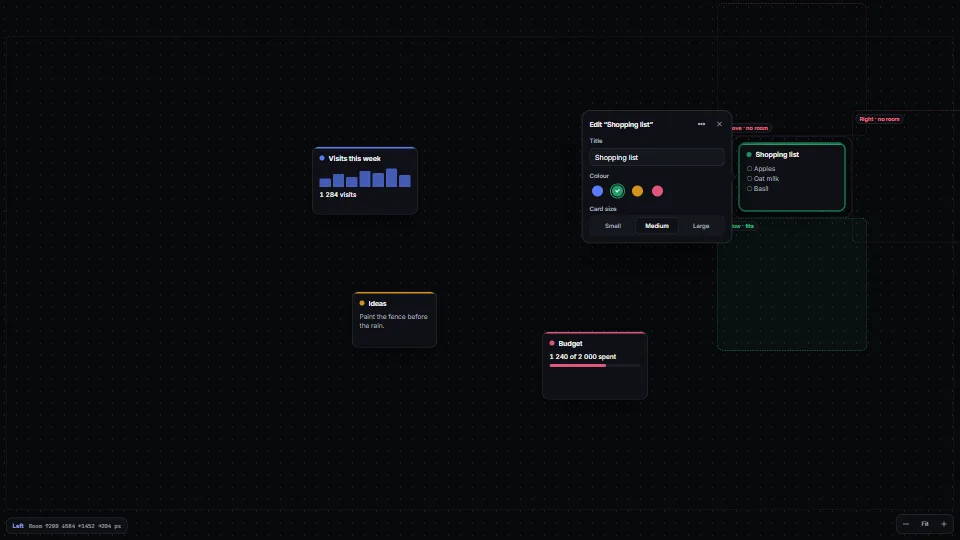
Puts an editor, popover or inspector beside the item it edits, never on top of it.
 Data & layout
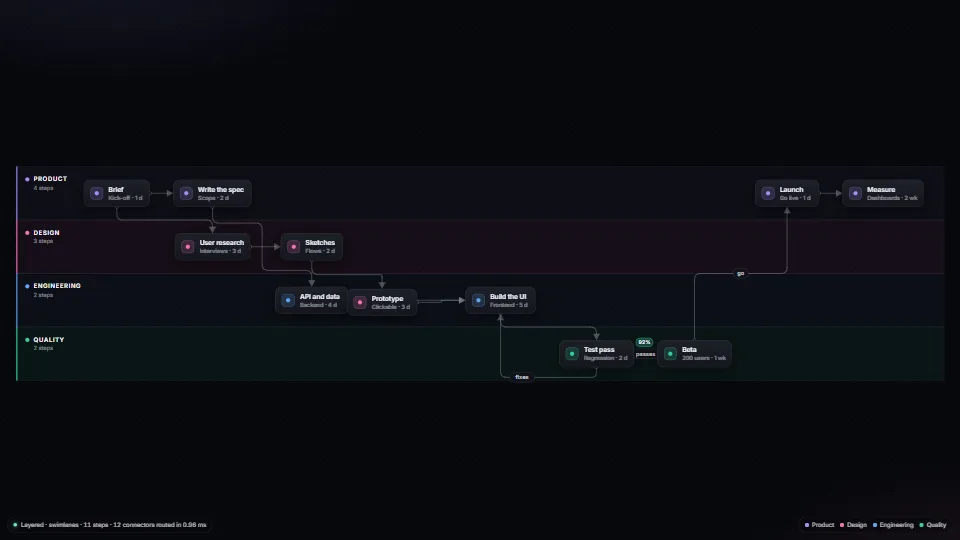
Orthogonal connectors routed round every box by A* over a sparse grid, with a bend cost and a tie-break that keeps elbow corners from flipping as things move…