Feature Library

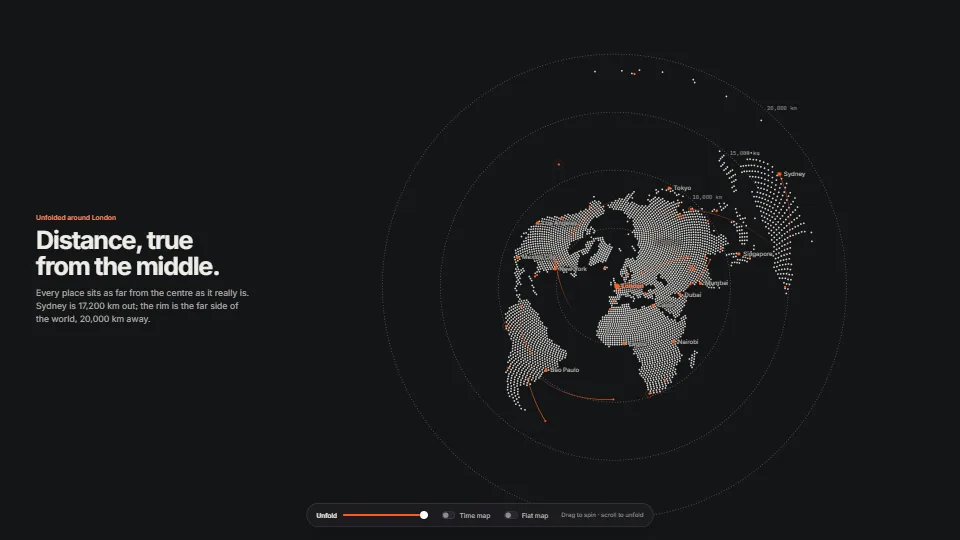
Dot globe that unfolds into a map

0.79 GPU · 0.36 CPU ms
A still of the Dot globe that unfolds into a map demo
Still
The live demo starts when it’s in view.Drag or arrows to spin · scroll or +/− to unfold · click a city to centre on it

The world drawn with one primitive, the anti-aliased dot.

What it costs a frame

0.79 ms
0.36 ms
GPU
0.79 ms
CPU, median
0.36 ms
CPU, 95th pct
0.82 ms
Draw calls
0
Weight
Moderate

Measured 11 November 2026 on 13th Gen Intel(R) Core(TM) i9-13900H, Chrome 157, 1920×1080 at 1×. 600 frames × 3 rounds, median kept. What ran: Measured exercising itself: the globe turns, three to four events a second fly, and it steps through globe, unfolded, time map and flat map every few seconds (258,000 dots, drawn every frame while anything moves). Phones: tiers are being measured next.

On every machine it was measured on
MachineGPU msCPU msCPU p95
unknown GPU · 13th Gen Intel(R) Core(TM) i9-13900Hreference · measuring tool0.790.360.82
apple · Apple A19 Proin a browser tab · 16 November 20266.591.563.26
Intel Arc 140V (Xe2-LPG) · Intel Core Ultra 7 258Vin a browser tab · 15 November 20260.520.721.51

Bars against one 16.7 ms frame. A browser-tab run is timed in a visible tab without the tool’s scripted input, so read it as close, not exact.

How steadily it runs on Intel Arc 140V (Xe2-LPG) · Intel Core Ultra 7 258V · in a browser tab

Typical frame ?
16.70 ms
1% low ?
56 fps
Varies by ?
±0.41 ms
All metricsIntel Arc 140V (Xe2-LPG) · Intel Core Ultra 7 258V · in a browser tab
p50p95p9916.02 ms17.98 ms +
How long each frame took. Most frames sit in the tall bars; a long tail to the right is hitching.

Frames run on a 60 Hz timer (a page demo), so most frames take about one tick, 16.7 ms: the spread around it is what matters.

Frames

Median (p50) ?
16.70 ms
p95 ?
17.52 ms
p99 ?
17.91 ms
Slowest ?
18.19 ms
Mean ?
16.74 ms
Standard deviation ?
0.41 ms
1% low ?
56 fps
0.1% low ?
55 fps
Hitches ?
0 of 600
Over budget ?
0 of 600

Main thread

Long tasks ?
0
Long frames ?
0
Event-loop delay ?
0.1 / 1.2 / 1.7 ms

Input

No input during this run. A browser-tab run plays none.

Memory

JavaScript heap ?
144 → 157 MB
Growth ?
+12.94 MB

What it needs

Renders with
WebGPUNeeds WebGPU: current Chrome and Edge, Safari 26+, Firefox 141+ on Windows.
Your browser
Checking…Looking for WebGPU
Depends on
NothingNo other packages

What it’s for

  1. A hero globe with live events
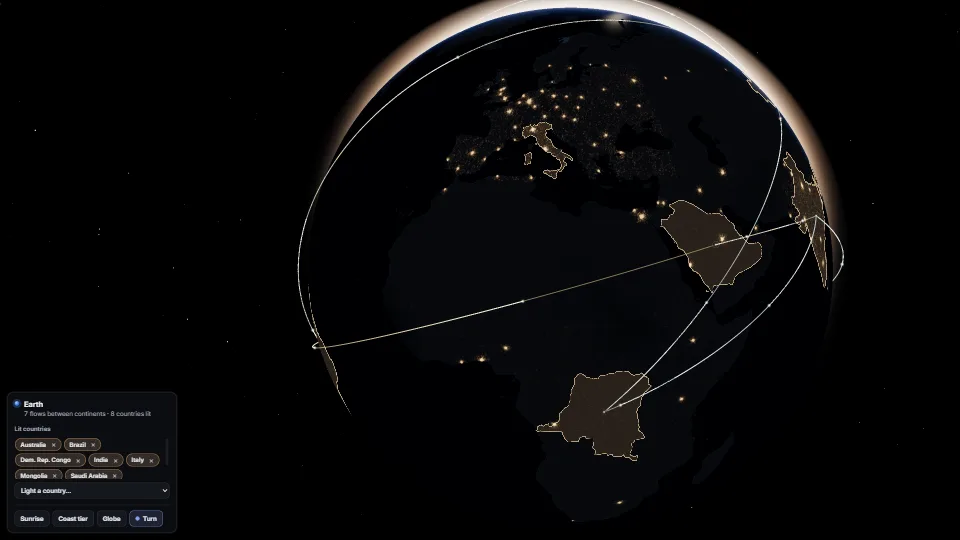
  2. Travel time or reach from one place
  3. Sites on a world map, labelled
  4. A story from globe to flat map
  5. Any per-place value as distance

Pitfalls, in brief

  1. Everything is in the canvas’s device pixels: multiply DOM rects and CSS sizes by the same dpr you passed to resize(), and divide placeDot’s answers by it to place DOM labels.
  2. The canvas is transparent (premultiplied alpha): the page’s background is the globe’s backdrop.
  3. placeDot (project.ts) is the shader’s place() on the CPU.
  4. The time map needs a value for every dot that should move: land and markers.
  5. Values are distances from the view’s centre: centre the view (lat0, lon0) on the place the values were measured from, or the time map is nonsense.
5 more in brief
  1. A value far above vMax lands outside the rim.
  2. draw() skips (returns false) while the last frame is still on the GPU: keep your dirty flag set and draw again next frame.
  3. Arcs crossing the flat map’s seam, or passing near the unfolded map’s rim, lose the one segment that would jump across: expected, not a bug.
  4. A finer lattice is more dots, not more detail: the coastlines are 1–2° precise.
  5. Without WebGPU createDotField resolves null. drawDotStill draws a still of the same dots on a 2D canvas; it costs tens of milliseconds, so draw it when the view changes, not every frame.
10 pitfalls in full, the hook-up guide, the module source and its tests come with the part.

Also as

Where it comes from

From HaTac. Fully custom code.

Bojan Šavrič, Tom Patterson & Bernhard Jenny, The Equal Earth map projection (2018): The flat map: their published polynomial, in WGSL and in TypeScript.

Azimuthal equidistant and orthographic projections: The unfolded map and the globe: classical projections, written from their definitions.

Ken Shoemake, Animating rotation with quaternion curves (SIGGRAPH 1985): Spherical linear interpolation: each arc follows the great circle between its ends.

Halftone screening: The three nested dot lattices that fade and grow as the world shrinks, so dots never shimmer below a pixel: the printing idea, done in the vertex shader.

globemapdotshalftoneazimuthal equidistantequal earthtime mapisochronesarcsflowsgreat circlecartogramraw webgpuwgsldom + gpudraw on demandno dependencies

Near it in the frame