 Data & layout
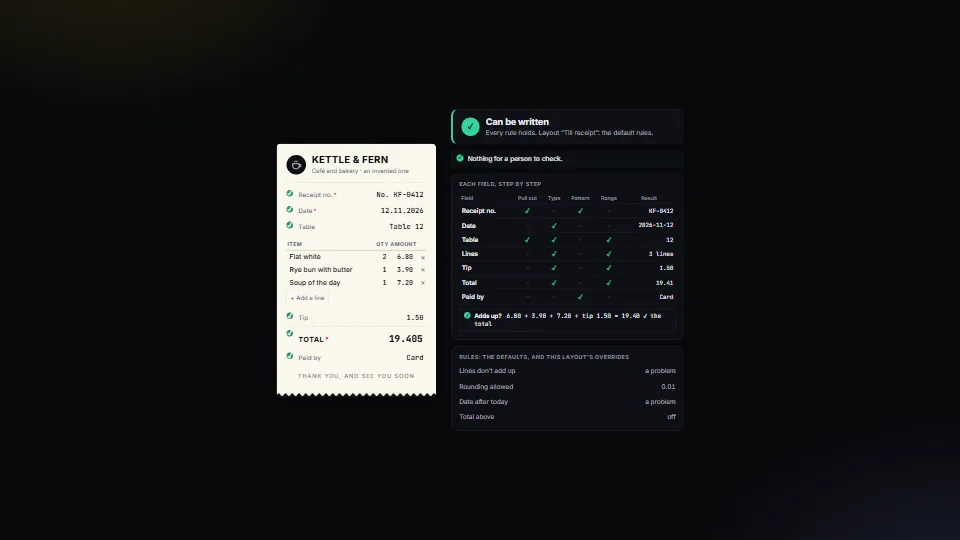
Field rules: when a person must check
Decides, for every value read from a document or a form, whether it can be written or a person must look, and says why in plain English.
0.47 CPU ms
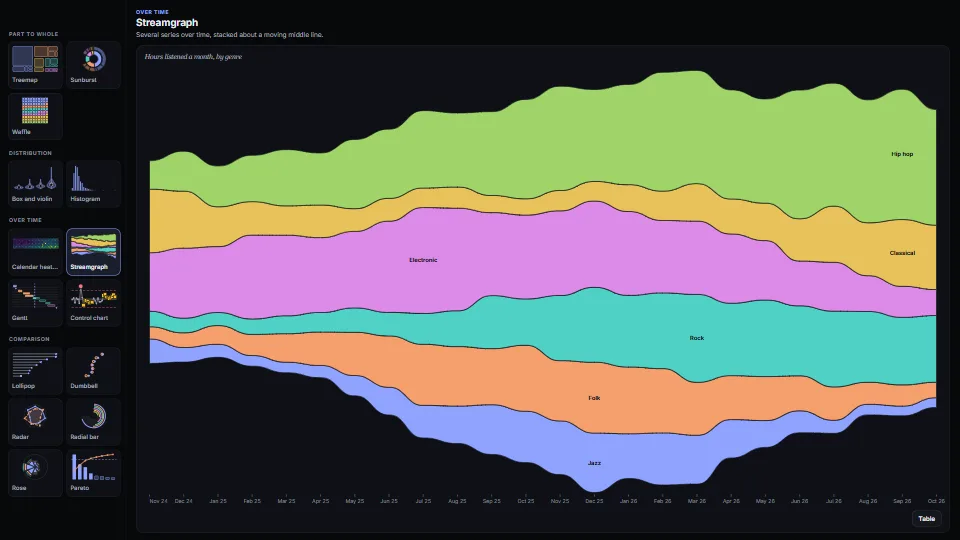
Fifteen chart types as plain functions that return SVG, each with its numbers as a table and words for every mark.
Measured 7 November 2026 on 13th Gen Intel(R) Core(TM) i9-13900H, Chrome 156, 1920×1080 at 1×. 600 frames × 3 rounds, median kept. What ran: Measured while the gallery cycles: every frame draws the next of the fifteen chart types at the stage’s size (the SVG string, innerHTML and the explorer’s listeners, without the draw-in), with new data after each full pass. Idle, nothing runs. Phones: tiers are being measured next.
| Machine | GPU ms | CPU ms | CPU p95 |
|---|---|---|---|
| unknown GPU · 13th Gen Intel(R) Core(TM) i9-13900Hreference · measuring tool | not timed | 0.52 | 2.12 |
| apple · Apple A19 Proin a browser tab · 16 November 2026 | not timed | 1.04 | 5.26 |
| Intel Arc 140V (Xe2-LPG) · Intel Core Ultra 7 258Vin a browser tab · 15 November 2026 | not timed | 0.90 | 3.28 |
Bars against one 16.7 ms frame. A browser-tab run is timed in a visible tab without the tool’s scripted input, so read it as close, not exact.
From SpaciousPro. Fully custom code.
Bruls, Huizing and van Wijk, “Squarified Treemaps” (2000): squarify() follows the paper’s algorithm: rows laid along the shorter side while they make the worst aspect ratio better.
Viridis, by Stéfan van der Walt and Nathaniel Smith (matplotlib, CC0): The ten stops in VIRIDIS are sampled from the colour map, which is in the public domain (CC0).
Lee Byron and Martin Wattenberg, “Stacked Graphs: Geometry & Aesthetics” (2008): The streamgraph’s “least wiggle” baseline is the paper’s formula; the code is the owner’s.
Walter A. Shewhart, Economic Control of Quality of Manufactured Product (1931): The individuals and moving-range (XmR) chart: limits three sigmas from the average, sigma from the average moving range ÷ 1.128 (d₂ for ranges of two), the range limit at 3.268 (D₄). The run of seven is a common run rule.
John W. Tukey, Exploratory Data Analysis (1977): The box plot, its whiskers to the last values within 1.5 times the box’s height.
B. W. Silverman, Density Estimation for Statistics and Data Analysis (1986): The violins’ Gaussian kernel density, its width by his rule of thumb.
Florence Nightingale’s polar area diagrams (1858): The rose: equal angles, radius by the square root so each slice’s area is true.
George Marsaglia, “Xorshift RNGs” (2003): The demo’s seeded generator for its invented data.
Data & layoutDecides, for every value read from a document or a form, whether it can be written or a person must look, and says why in plain English.
 Data & layout
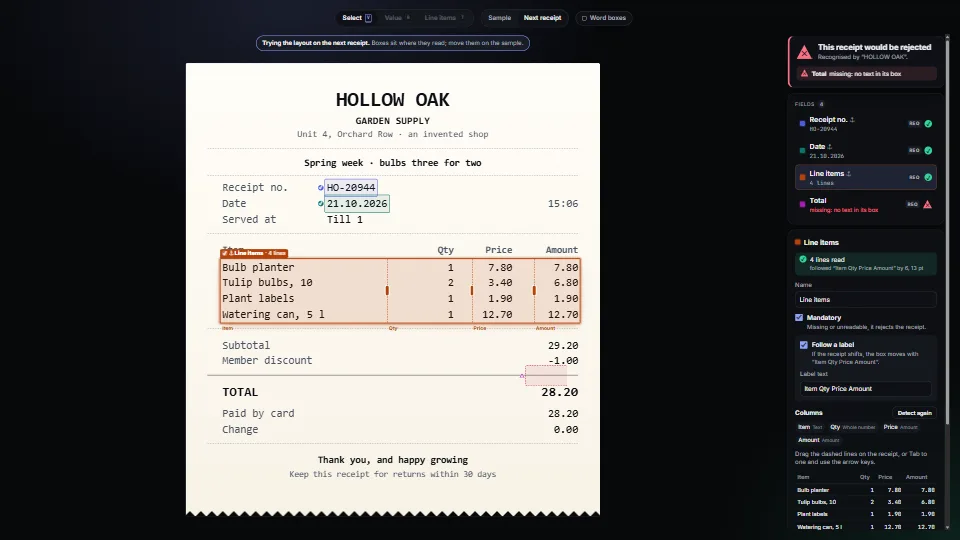
Map where each value sits on a PDF or a scan with a text layer, from nothing but its words and their boxes.
 Data & layout
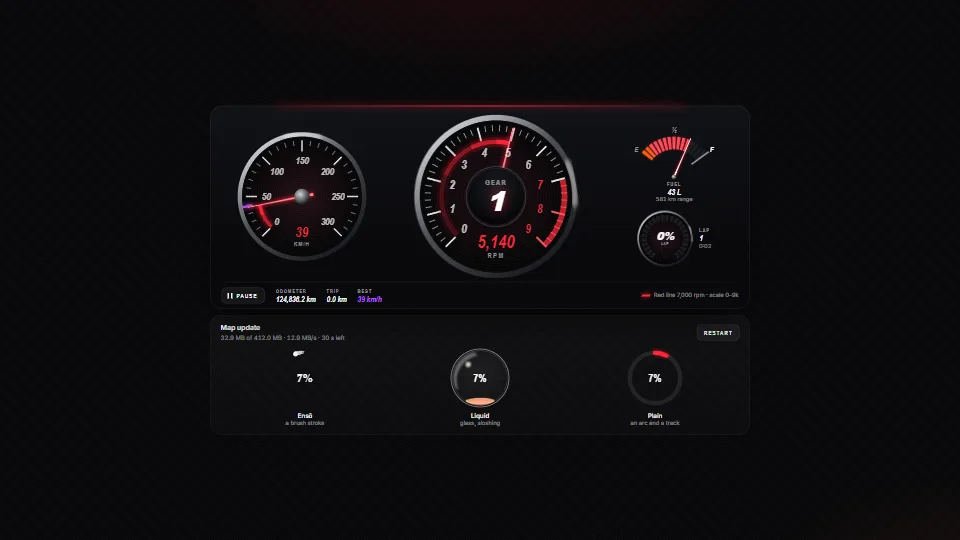
Instrument gauges in SVG (a tach with a red line on a nice scale, a speedometer with a best mark, a fuel gauge and an LED ring) whose needles chase their…
 Data & layout