 Systems & tooling
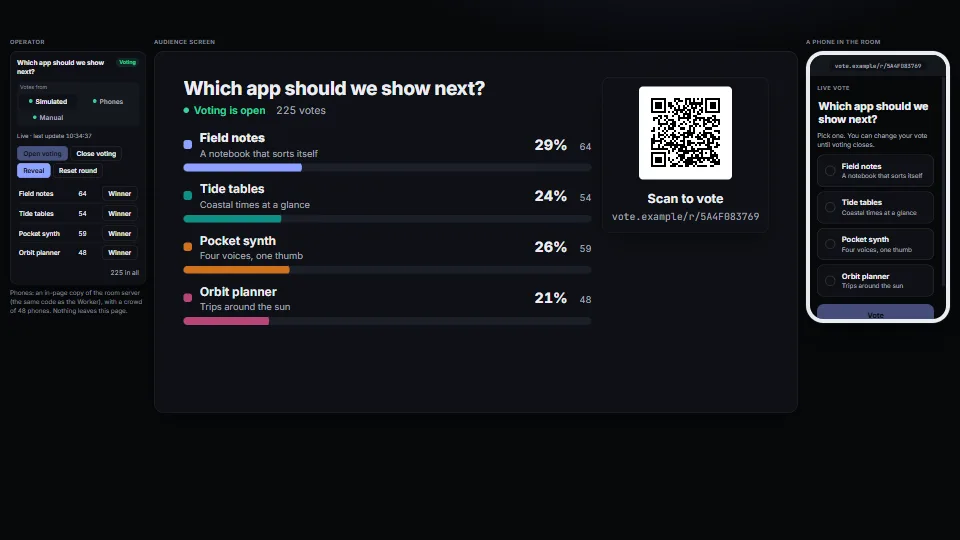
Audience vote
The room votes on their phones and the stage shows a live tally (bars or a ring) and an awards-style reveal: nominee cards, a drum roll, the winner, ties handled.
<0.01 CPU ms
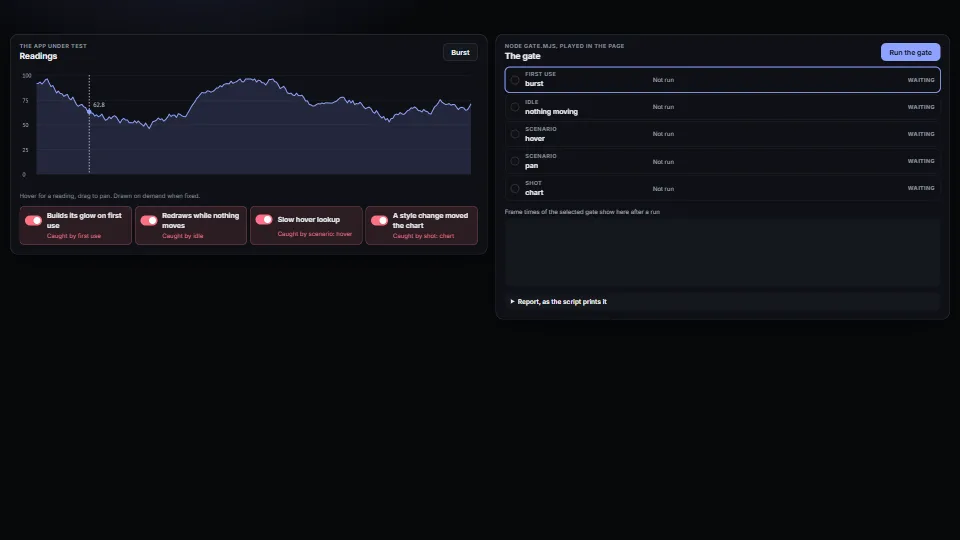
A gate an app copies, with no packages: one Node script opens the app in headless Chrome on a fresh profile at an exact viewport and fails the run when a budget breaks.
Measured 13 November 2026 on RTX 4060 Laptop, 13th Gen Intel(R) Core(TM) i9-13900H, Chrome 157, 1920×1080 at 1×. 600 frames × 3 rounds, median kept (rounds ranged CPU 0.03–0.03 ms). What ran: Measured exercising itself with every bug fixed: each frame moves the hover across the chart (the handler and one on-demand draw). Idle, the chart draws nothing; a gate run is not part of the bench. Phones: tiers are being measured next.
| Machine | GPU ms | CPU ms | CPU p95 |
|---|---|---|---|
| RTX 4060 Laptop · 13th Gen Intel(R) Core(TM) i9-13900Hreference · measuring tool | not timed | 0.03 | 0.04 |
| apple · Apple A19 Proin a browser tab · 16 November 2026 | not timed | 0.02 | 0.02 |
| Intel Arc 140V (Xe2-LPG) · Intel Core Ultra 7 258Vin a browser tab · 15 November 2026 | not timed | 0.06 | 0.10 |
Bars against one 16.7 ms frame. A browser-tab run is timed in a visible tab without the tool’s scripted input, so read it as close, not exact.
From SpaciousPro. Fully custom code.
Chrome DevTools Protocol: the gate drives Chrome with its Page, Runtime, Input and Emulation domains (no code taken)
PNG (Portable Network Graphics) Specification: the chunk layout, CRC-32 and the five row filters png.ts reads and writes (Paeth’s predictor among them)
mulberry32 (Tommy Ettinger): the seeded random generator behind the demo’s chart data, a public-domain snippet kept as it is (demo only, not in the module)
Systems & toolingThe room votes on their phones and the stage shows a live tally (bars or a ring) and an awards-style reveal: nominee cards, a drum roll, the winner, ties handled.
 Systems & tooling
 Systems & tooling
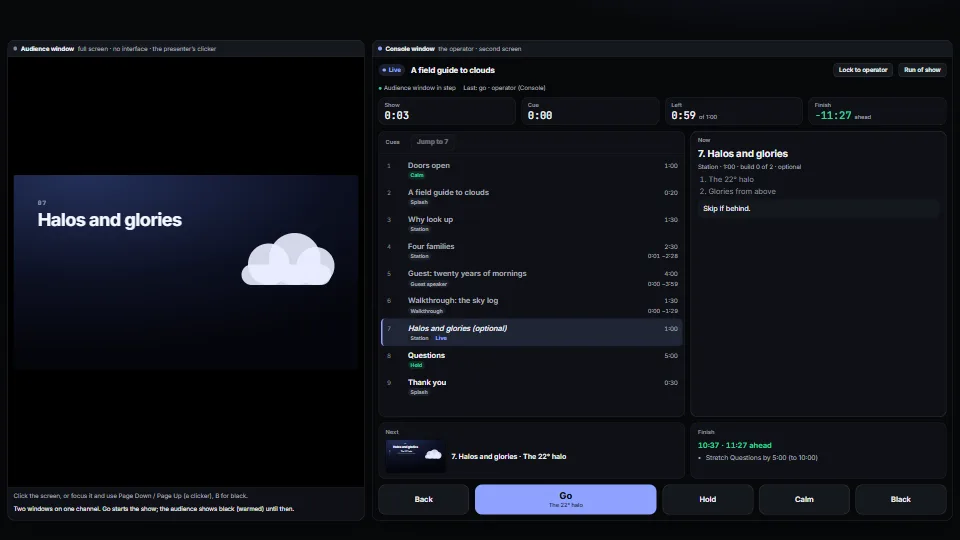
Runs a live presentation from a cue list: go, back, jump, hold, calm and black, with builds inside a cue, from any clicker, the keyboard or the console.
 Systems & tooling
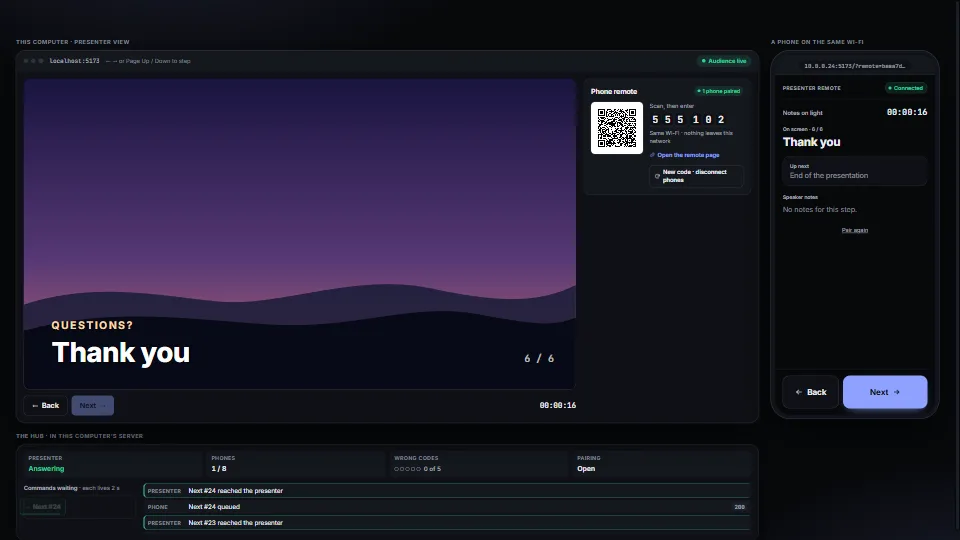
A phone on the same Wi-Fi steps a presentation, with no cloud and no app: scan a QR code, type a six-digit code, and Next and Back go to the presenting machine.