 UI & interaction
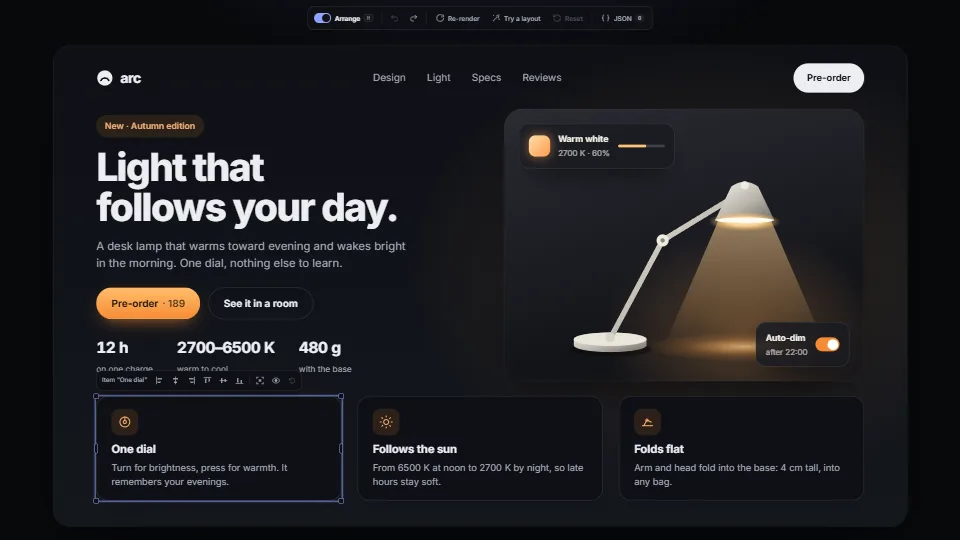
Arrange any page in place
Move, resize, hide, line up and spread the parts of any live HTML page, like shapes on a slide: smart guides and equal gaps, several at once, the keyboard too, and undo.
0.35 CPU ms
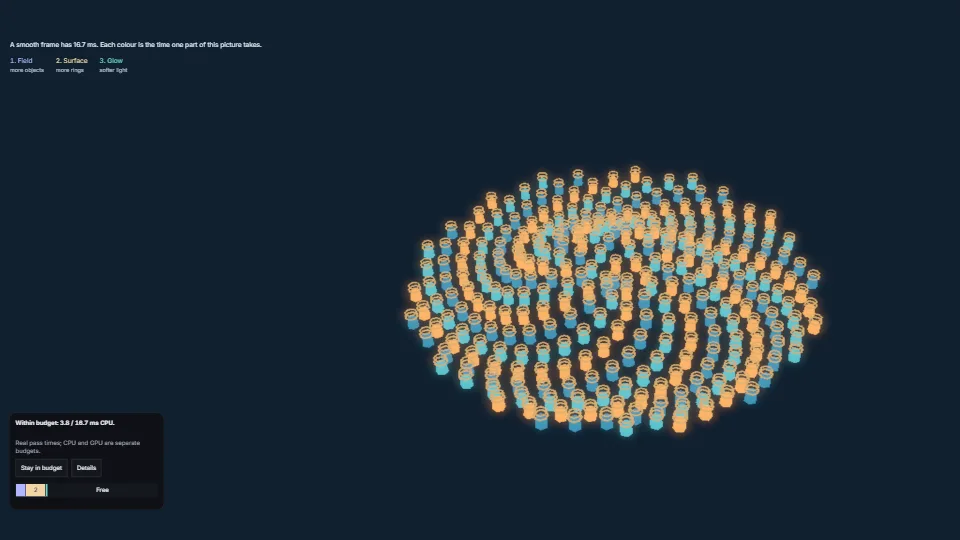
Labelled pass costs against a 16.7 ms frame budget, with separate CPU and GPU views, focusable details and a compact corner mode.
Three.js inspector timestamps and raw WebGPU pass wrappers keep asynchronous GPU results paired with their CPU frame; missing queries stay unavailable.
Measured 19 November 2026 on RTX 4060 Laptop, 13th Gen Intel(R) Core(TM) i9-13900H, Chrome 157, 1920×1080 at 1×. 600 frames × 3 rounds, median kept (rounds ranged GPU 0.30–0.31, CPU 0.35–0.37 ms). What ran: The meter itself, with the picture it times kept as light as the controls allow: 60 field meshes, no surface rings, one blur step and the final composite, at a fixed 1024×768 work resolution. The meter paints at 4 Hz. The in-use view measures the default picture (300 meshes, two rings, eight blur steps), which is the demo’s deliberate workload, not the meter’s cost. Phones: tiers are being measured next.
Frames run back to back, each starting once the GPU has finished the last, so frame times show the work itself. They have a floor of about 4–5 ms from the browser’s own scheduling: GPU and CPU ms stay the measure of cost.
install("frame-meter")Your coding agent reads its pitfalls and installs it through the library’s MCP server. Set it upWritten for the library. Adapted from published work, named below.
Hannes Andersson: Feature Library and grid-ui timestamp readback pattern.
UI & interactionMove, resize, hide, line up and spread the parts of any live HTML page, like shapes on a slide: smart guides and equal gaps, several at once, the keyboard too, and undo.
 UI & interaction
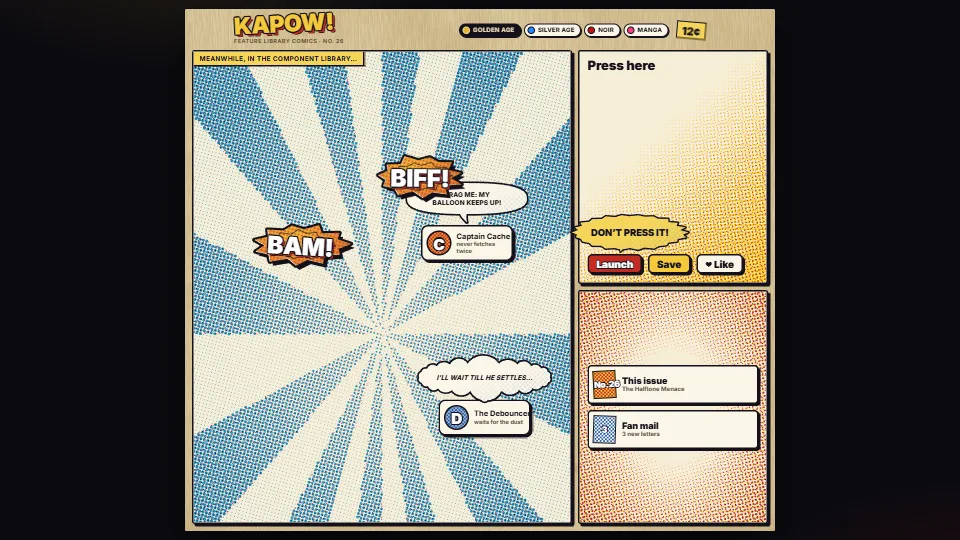
Sound-effect words that pop with squash and stretch over an inked starburst, speech, thought and shout balloons whose tails keep pointing at their target as it…
 UI & interaction
 UI & interaction
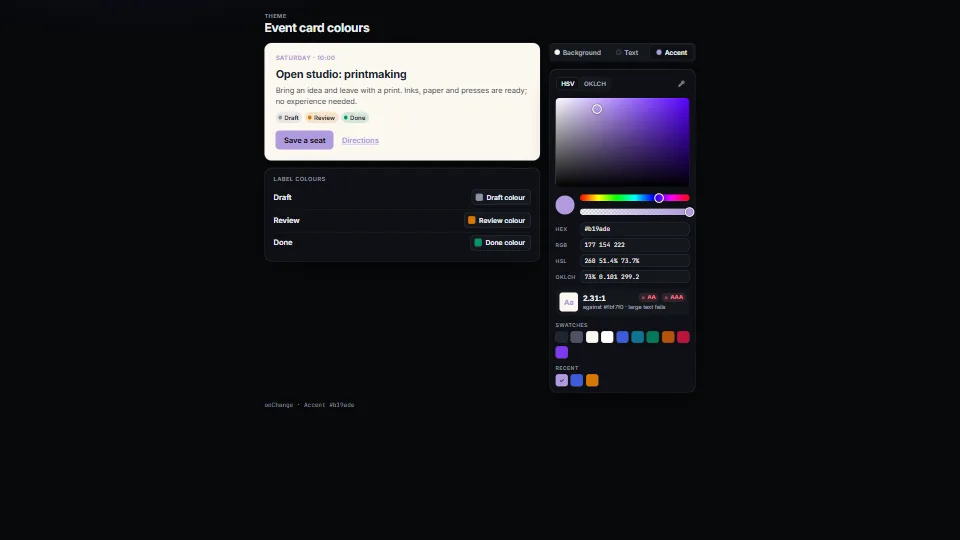
A colour picker that does not drift: a saturation × brightness plane or an OKLCH lightness × chroma plane with the edge of sRGB drawn on it, hue and opacity…