 Data & layout
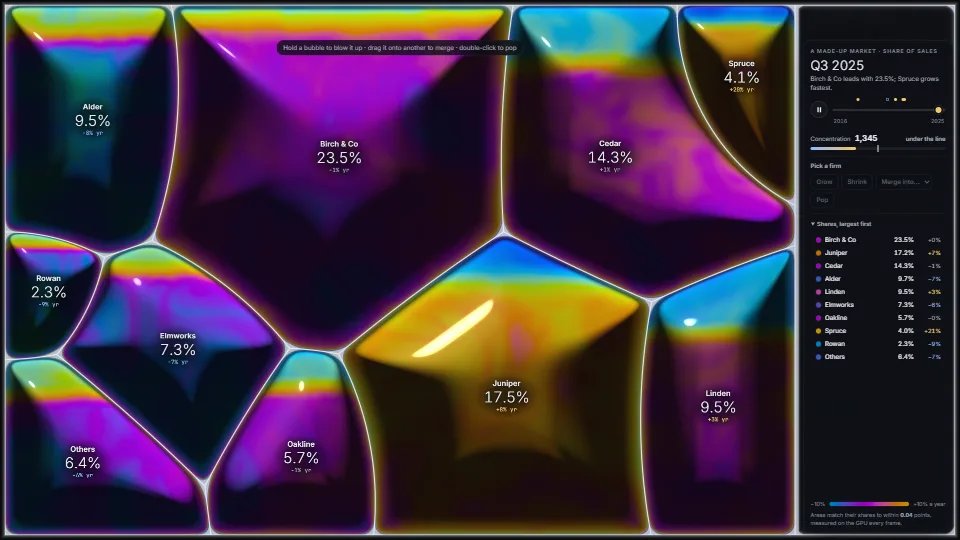
Foam treemap
A treemap made of soap foam, where every bubble’s area is exactly its share.
4.73 GPU · 0.33 CPU ms
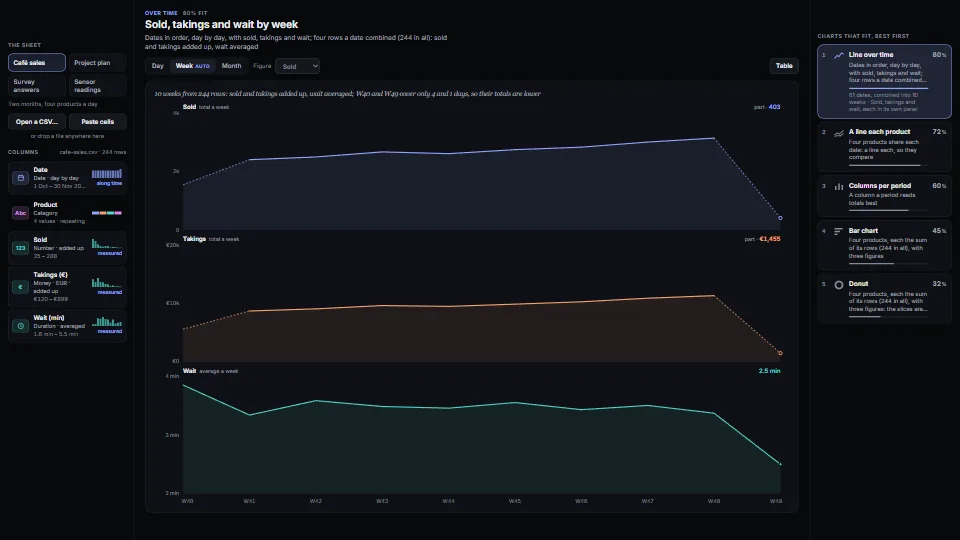
Hand it any table, pasted cells or a CSV, and it reads what each column holds (dates, money, percentages, durations, categories, IDs, free text, yes or no…
Measured 11 November 2026 on 13th Gen Intel(R) Core(TM) i9-13900H, Chrome 157, 1920×1080 at 1×. 600 frames × 3 rounds, median kept. What ran: With bench on, every frame reads the next sample sheet (parse, profile, rank) and draws its next suggestion: the whole pipeline, about 250 to 650 rows a sheet. Phones: tiers are being measured next.
| Machine | GPU ms | CPU ms | CPU p95 |
|---|---|---|---|
| unknown GPU · 13th Gen Intel(R) Core(TM) i9-13900Hreference · measuring tool | not timed | 6.01 | 12.4 |
| apple · Apple A19 Proin a browser tab · 16 November 2026 | not timed | 7.59 | 13.3 |
| Intel Arc 140V (Xe2-LPG) · Intel Core Ultra 7 258Vin a browser tab · 15 November 2026 | not timed | 12.2 | 22.2 |
Bars against one 16.7 ms frame. A browser-tab run is timed in a visible tab without the tool’s scripted input, so read it as close, not exact.
how: money and counts added up; percentages, durations, yes-or-no and levels (°C, scores, ratings) averaged.ambiguous is set, offer both readings rather than picking for the person.From SpaciousPro. Fully custom code.
Bruls, Huizing and van Wijk, “Squarified Treemaps” (2000): draw.ts squarify() lays rows along the shorter side while they make the worst aspect ratio better; the code is written for the library.
Paul Heckbert, “Nice Numbers for Graph Labels”, Graphics Gems (1990): niceTicks rounds the tick step to 1, 2, 2.5 or 5 times a power of ten: the idea, not his code.
WAI-ARIA Authoring Practices Guide (W3C): The radio group pattern for the samples and the period picker in the demo, the listbox pattern for the suggestions (selection does not follow focus: arrows move, Enter or Space picks); a chart as one Tab stop read with the arrow keys.
George Marsaglia, “Xorshift RNGs” (2003): The demo’s seeded generator for its invented sample sheets.
Data & layoutA treemap made of soap foam, where every bubble’s area is exactly its share.
 Data & layout
 Data & layout
 Data & layout
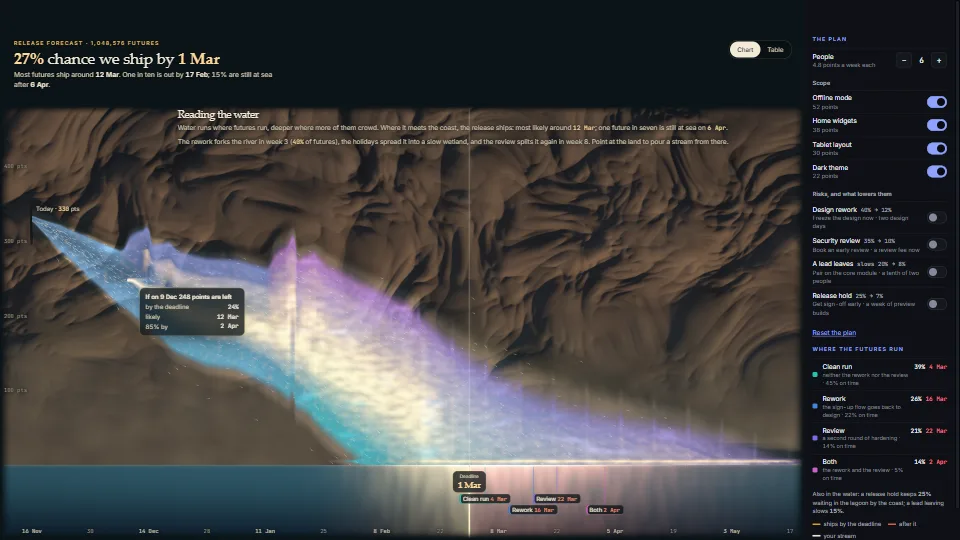
A Monte Carlo burndown drawn as land and water.