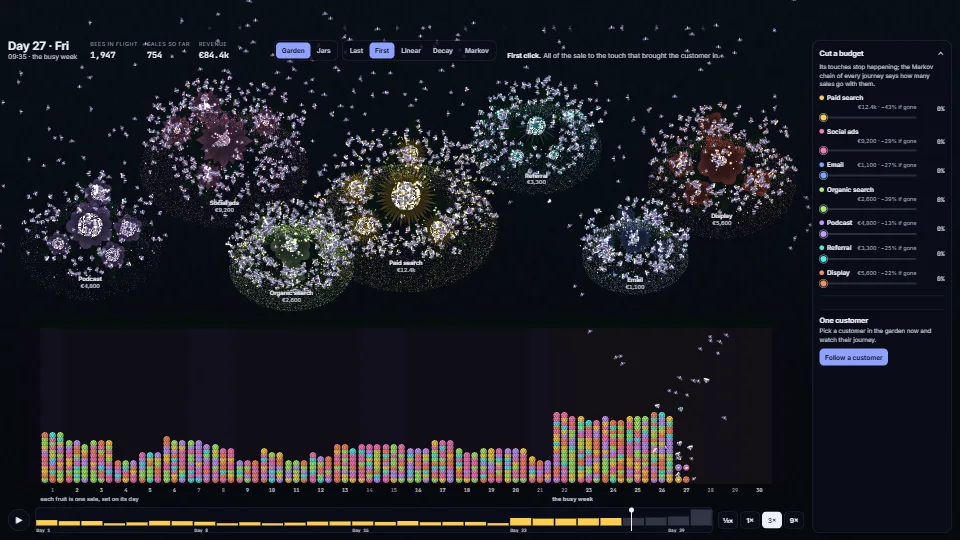
 Data & layout
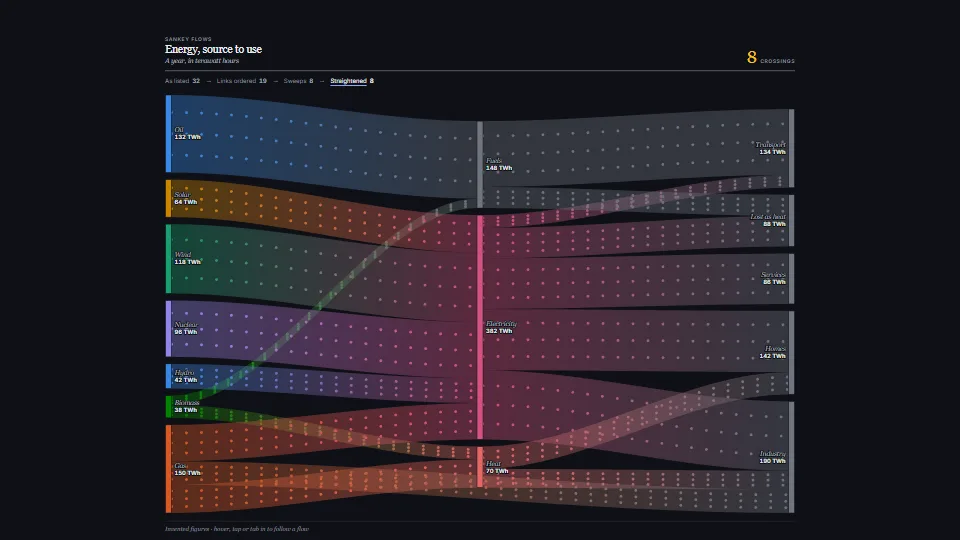
Sankey flows with few crossings
3.60 CPU ms
Still
The live demo starts when it’s in view.Hover or tap a band or node to light its path · Tab in and travel with the arrow keys · toggle the layout steps
A Sankey diagram that keeps its flows readable.
What it costs a frame
3.60 ms
- GPU
- not used
- CPU, median
- 3.60 ms
- CPU, 95th pct
- 4.65 ms
- Draw calls
- 0
- Weight
- Heavy
Measured 7 November 2026 on 13th Gen Intel(R) Core(TM) i9-13900H, Chrome 156, 1920×1080 at 1×. 600 frames × 3 rounds, median kept. What ran: Measured while the flows change every frame: each frame shuffles the input order and lays the chart out again (barycentre sweeps with a crossing count after each, relaxation, link order), rebuilding the SVG, moving to the next set of flows every 40 frames, particles on. The demo’s four-step readout (four more layouts) is counted once a set, not every frame. Idle, only the particles’ CSS animation runs. Phones: tiers are being measured next.
| Machine | GPU ms | CPU ms | CPU p95 |
|---|---|---|---|
| unknown GPU · 13th Gen Intel(R) Core(TM) i9-13900Hreference · measuring tool | not timed | 3.60 | 4.65 |
| apple · Apple A19 Proin a browser tab · 16 November 2026 | not timed | 5.76 | 6.94 |
| Intel Arc 140V (Xe2-LPG) · Intel Core Ultra 7 258Vin a browser tab · 15 November 2026 | not timed | 9.78 | 12.8 |
Bars against one 16.7 ms frame. A browser-tab run is timed in a visible tab without the tool’s scripted input, so read it as close, not exact.
What it needs
- Renders with
- DOM and CSSPlain DOM and CSS: every current browser.
- Your browser
- Runs hereNo WebGPU needed
- Depends on
- NothingNo other packages
What it’s for
- Energy and material flows
- Budgets: income to spending
- Website and funnel journeys
- Migrations and transfers between groups
- Where time or money goes in a report
- Any staged breakdown of a total
Pitfalls, in brief
- Import sankey.base.css before sankey.css: the base holds the palette slots the chart writes into its nodes and bands, the particles’ dashes and the tucked labels; without it the bands draw black and solid.
- Flows must not loop: a link that closes a cycle (or runs backwards between columns you set by hand) is dropped and listed in graph.dropped.
- Give the host a height: the chart fills its box and redraws at a new size (a ResizeObserver), never scaled, so text and hairlines stay crisp.
- A node’s size is the larger of what flows in and out.
- Crossing counts grow with the square of the links (each pair is sampled 33 times): fine for a few hundred links; for thousands, pass optimise: false and order the input yourself.
4 more in brief
- Colour follows the node, not its rank: give nodes their own
colourwhen a list can be reordered or filtered, or a shuffle repaints them. - The particles are a CSS animation on dashed strokes: free in script, but they keep the page painting.
- The figure is one Tab stop with role="application" so the arrow keys reach it under a screen reader; the flows are also a hidden table beside it, which browse mode reads.
- Labels are cut to the room before the next column and hidden where they would overlap a bigger node’s label; the tooltip, the words and a lit path always show them in full.
9 pitfalls in full, the hook-up guide, the module source and its tests come with the part.
Where it comes from
From SpaciousPro. Fully custom code.
Sugiyama, Tagawa and Toda, “Methods for Visual Understanding of Hierarchical System Structures” (IEEE SMC, 1981): Layered drawing with barycentre ordering to reduce crossings: the idea behind the sweeps. The code is the owner’s.
Gansner, Koutsofios, North and Vo, “A Technique for Drawing Directed Graphs” (IEEE TSE, 1993): The transpose step: swapping neighbours in a column after the sweeps while a swap removes crossings. The code is the owner’s.
d3-sankey (Mike Bostock, ISC): The idea of ordering links at each node by where they go and come from, and of relaxing node heights toward their neighbours. No d3 code is included.
WAI-ARIA Authoring Practices Guide (W3C): The roving one-Tab-stop keyboard pattern and polite live-region announcements, applied to a graph.
Edward Tufte, The Visual Display of Quantitative Information: Direct labels instead of a legend, and the least ink that carries the data: the look the library’s charts share.
Near it in the frame
Data & layout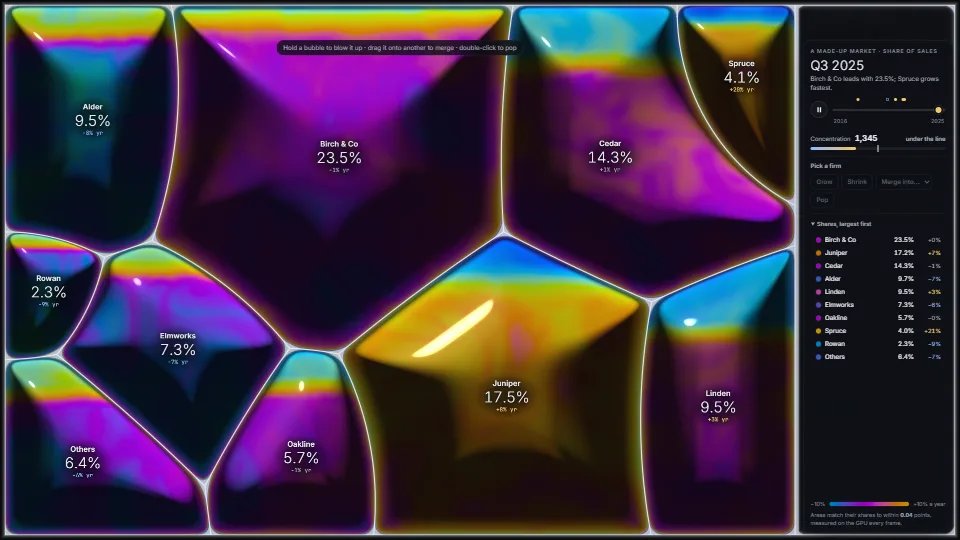 Data & layout
Foam treemap
A treemap made of soap foam, where every bubble’s area is exactly its share.
4.73 GPU · 0.33 CPU ms
 Data & layout
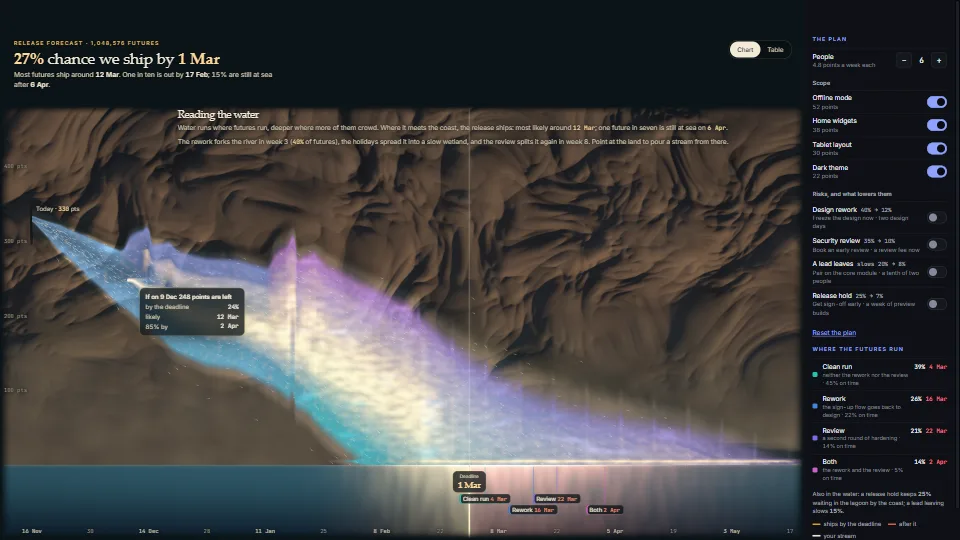
A million futures as a river delta
A Monte Carlo burndown drawn as land and water.
2.12 GPU · 0.68 CPU ms
 Data & layout
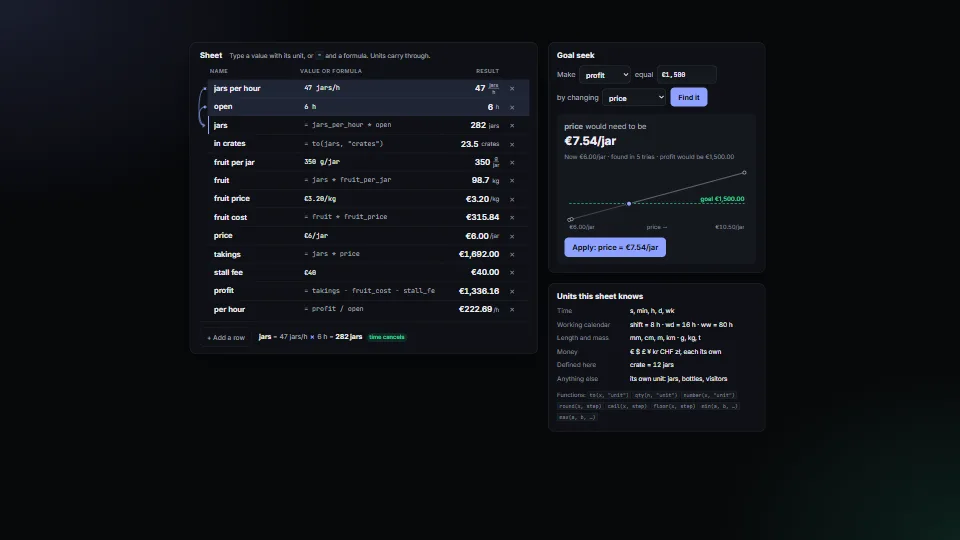
Units that carry through arithmetic, and goal seek
Numbers that keep their units through every step.
1.57 CPU ms